Enhance Organic Social Media Using Analytics and Insights
One of the best ways to ensure that your online marketing strategies are successful is to use analytics. There are plenty of official and third-party tools that can help with this process, especially when it comes to social media. In this guide, we’re going to show you how to leverage analytics and insights to increase the effectiveness of your organic social media campaigns.
As a leading social media agency, Zion & Zion strongly emphasizes analytics. We use an array of tools to better track, test, and analyze our client social media pages (as well as our own). After reading this article, you’ll be able to begin leveraging analytics to enhance your organic social media growth.
Official Sources for Social Media Analytics
First, let’s look at the official data sources you can tap into for social media analytics and insights, based on organic social media activity.
Facebook Page Insights
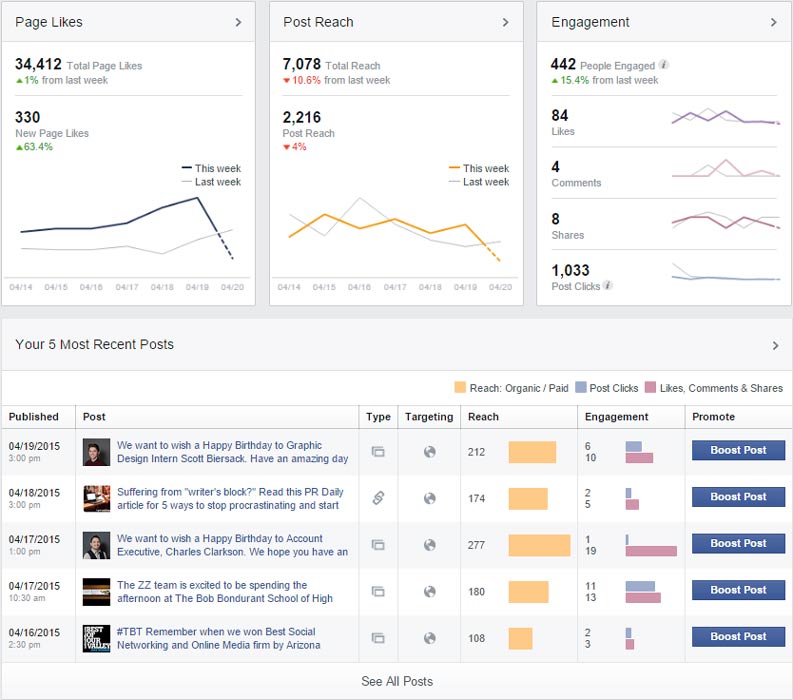
Facebook page owners can look at their insights to find out virtually everything they need to know about their page’s growth and engagement. You can start with the basics in the Overview tab. The Overview tab covers your page’s growth in terms of the number of fans your page has, the number of unique views your posts are getting (reach), and the level of engagement for each post, along with detailed analysis of your latest Facebook posts.
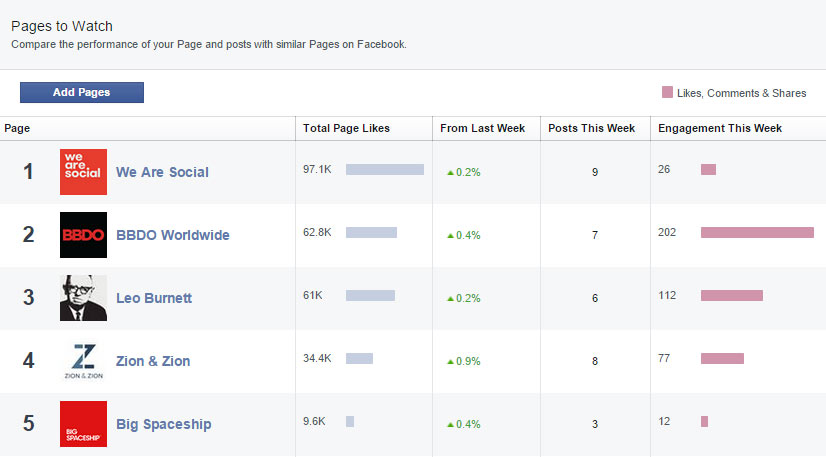
Beneath this data, you can add your competitors to Pages to Watch. This section allows you to track your competitors’ growth in fans and engagement. If you notice one that has particularly high stats, you can visit that page to see what they did to boost their engagement. You should note, however, that if you choose to watch a page, they will get a notification that you are doing so.
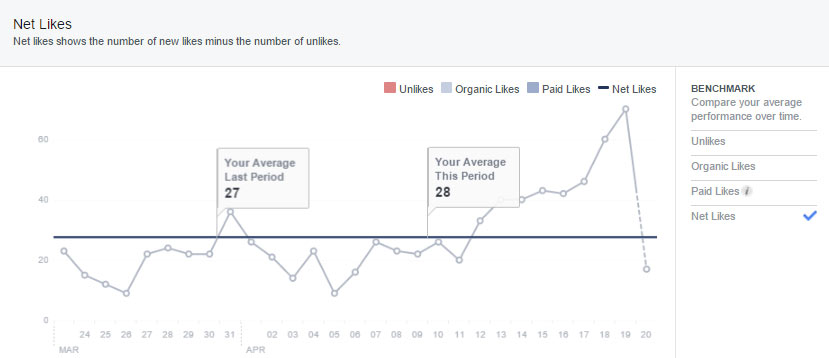
On the Likes tab, you can see a detailed analysis of the growth of your page’s fans (i.e., how many people like your page). In particular, you will want to look at the chart for net likes (new likes minus unlikes) and the source of new likes (organic vs. paid). A large number of likes or unlikes might warrant a review of your Facebook strategy.
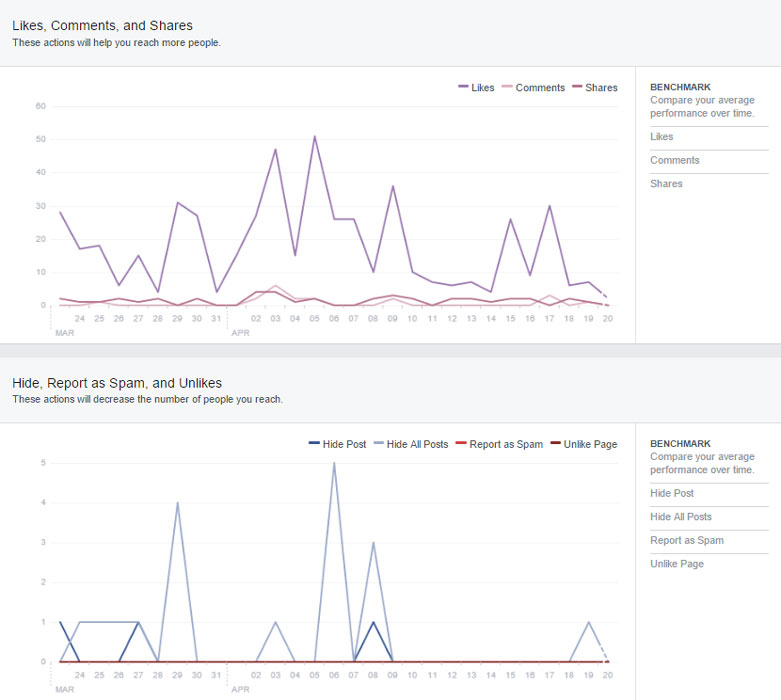
On the Reach tab, you can see a detailed analysis of the reach of your page’s posts. In particular, you will want to look at the charts for positive post feedback (likes, comments, and shares) versus negative post feedback (hide, report as spam, and unlikes). If you look at just the positive post feedback, you might miss when a large majority of your audience doesn’t enjoy the content you post.
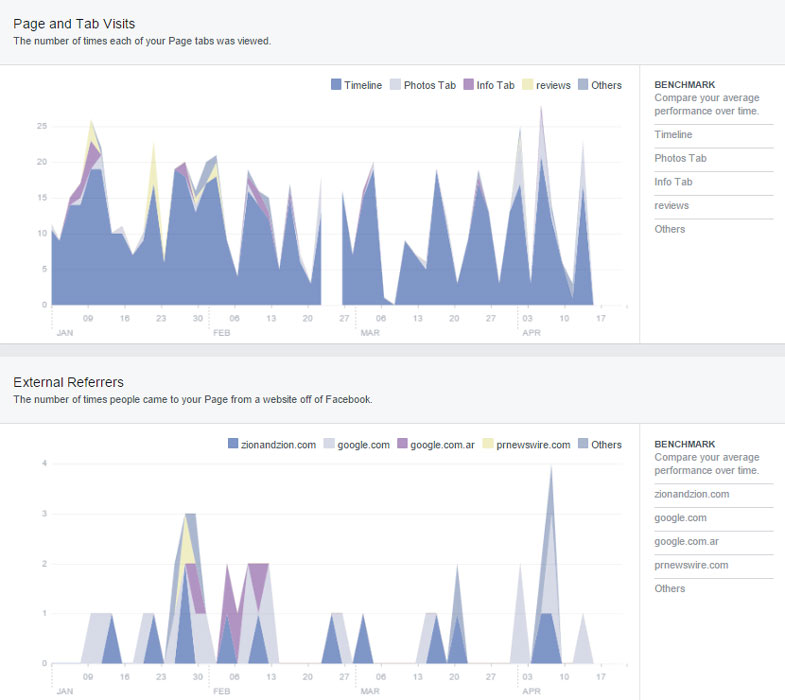
On the Visits tab, you can see a detailed analysis of where visitors go on your Facebook page and where they come from. This analysis can come in handy for page owners that have custom content tabs. If you are paying monthly fees for apps that no one is visiting, then you may want to consider removing them. You can also learn how people find your page in the first place.
On the Posts tab, you can see a detailed analysis of your latest Facebook page posts. In addition to details about the reach and engagement of your latest posts, you can also see other helpful information. For example, when to post (based on days/times your fans are online), what post types performed best, and the top posts by competitors in Pages to Watch.

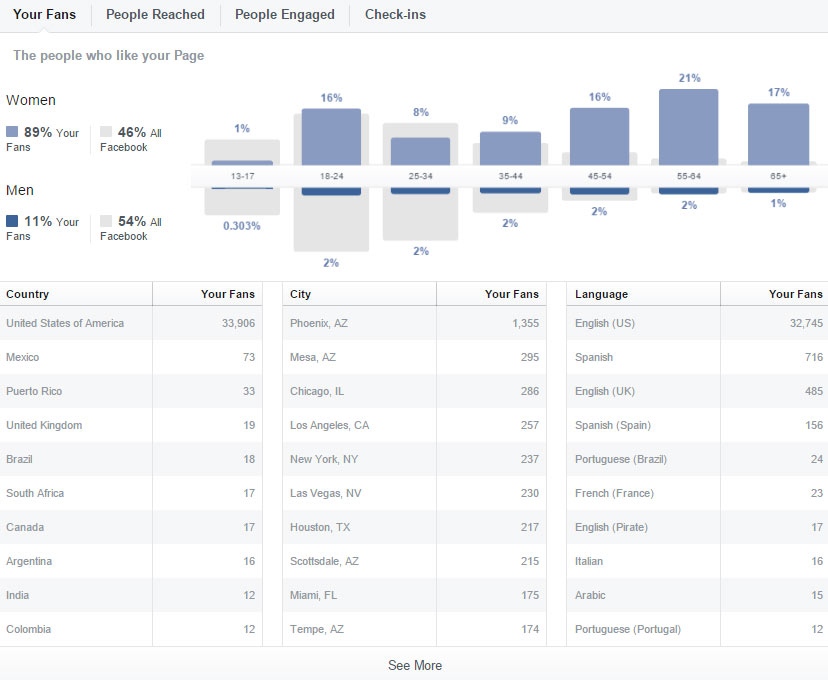
On the People tab, you can learn basic demographics about your page’s fans, the people your posts reach, and the people engaging with your posts.
You can export most of your page and post data using the Export button at the top right of your Facebook Insights. This feature can be particularly useful if you want to analyze how well your Facebook page posts have performed. Within the exported spreadsheet, you can sort the posts by most likes, most comments, most shares, most unlikes, type, date, times, etc.
Facebook app developers will also find a great analytics platform to tell them more about their app users.
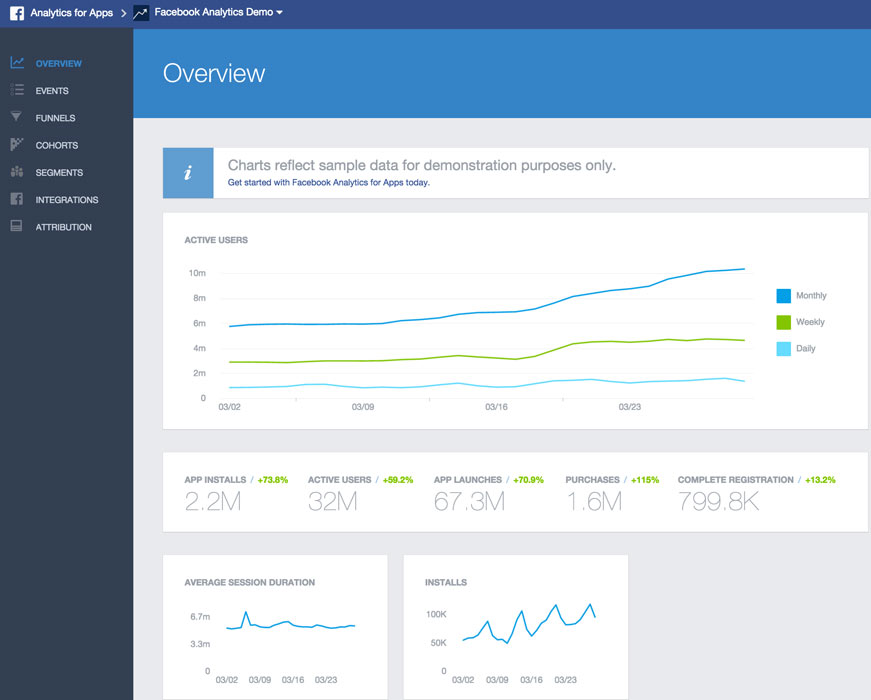
Overall, Facebook currently offers the best free analytics tools for businesses, compared with other social networks out there. If you’re not using Facebook Insights for your page, ads, and apps, you’re missing out on valuable data!
Twitter Profile Analytics
Twitter now offers its own analytics for Twitter users. The first thing you see on the dashboard is an overview of your profile’s key stats for audience size and engagement.

You then see details about your most popular tweets, mentions, and tweets from your website (for those using Twitter Cards).
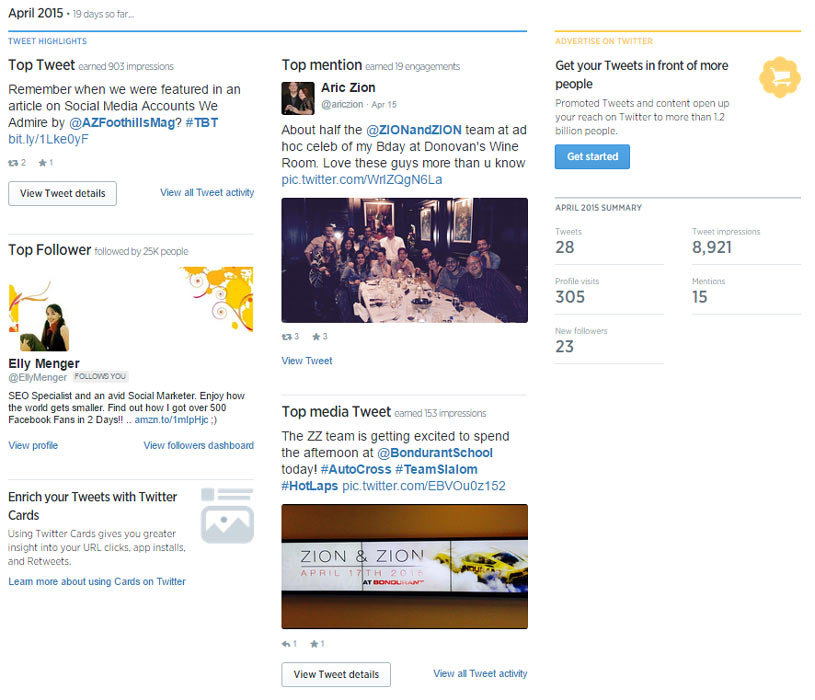
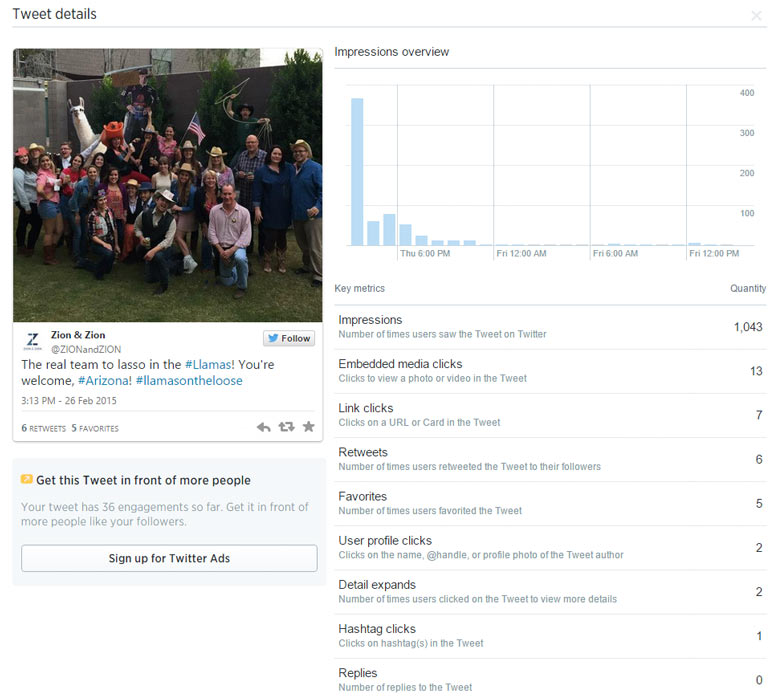
As you scroll down, the page will continually refresh with additional analytics, including your most popular tweets, mentions, and tweets from your website from previous months, along with monthly summaries of growth and engagement changes. From here, you can click through to view your tweet activity to see details about your latest tweets.
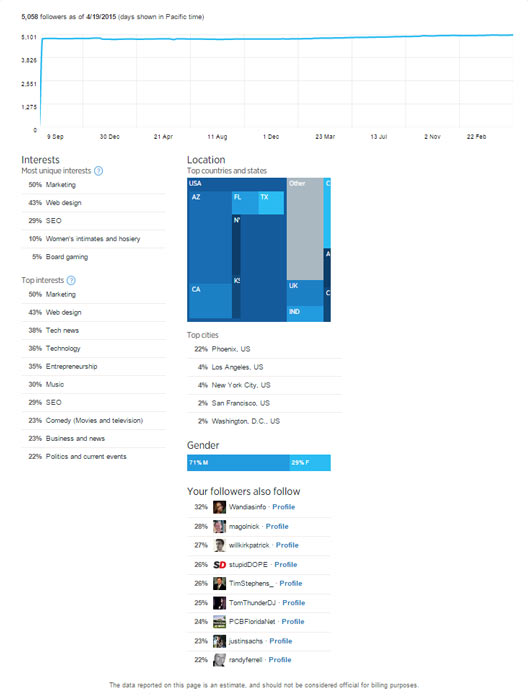
You can click through to your Follower dashboard, which shows basic demographics and interests of your followers.
You can also click through to your Card Analytics to see analytics about the tweets from your website, if you’re using Twitter Cards. These analytics include a high-level summary of engagement, a detailed view of the most popular links shared on Twitter, and the influencers that share those links. You’ll even get to see the social sharing tools that influencers use to share your links, such as Buffer and HootSuite.
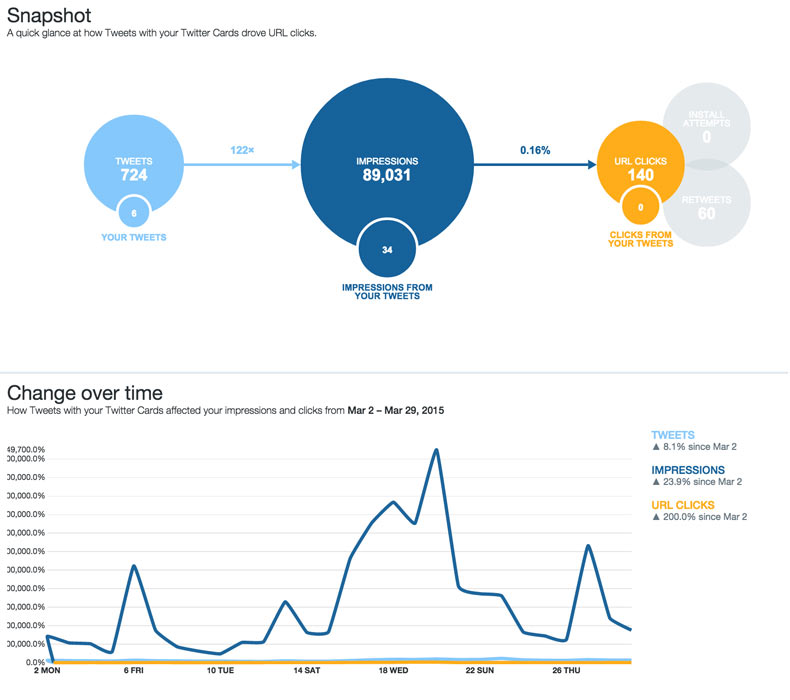
Overall, Twitter analytics has grown and offers a wealth of data for businesses. It’s not quite as extensive as Facebook, but it is nonetheless highly informative.
LinkedIn Profile & Page Analytics
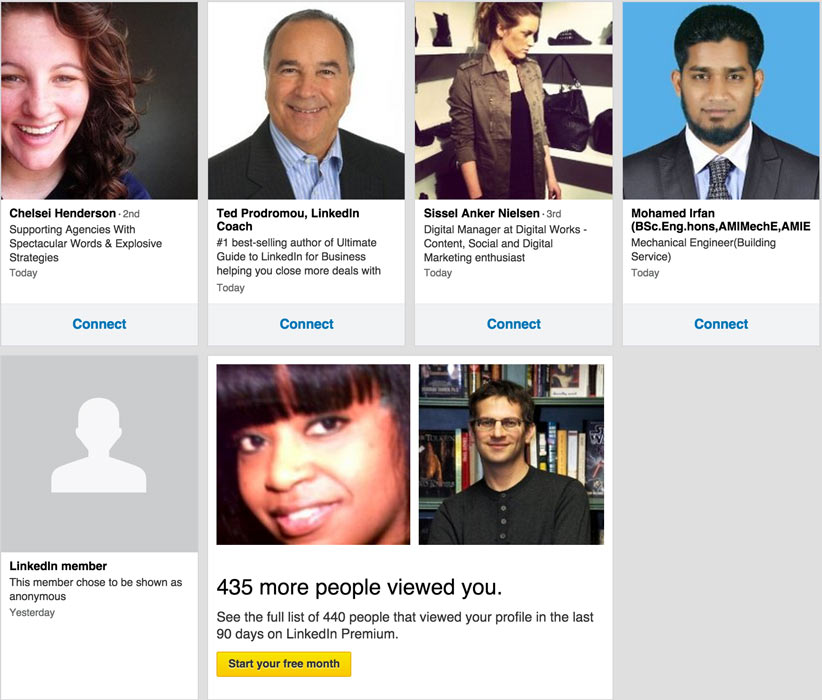
LinkedIn offers some basic analytics for both professional profile and company page users. Profile users can benefit from seeing analytics such as the number of views their profile has received, how people discovered their profile (Google search, LinkedIn search, etc.), the job titles of people who viewed their profile, and more.
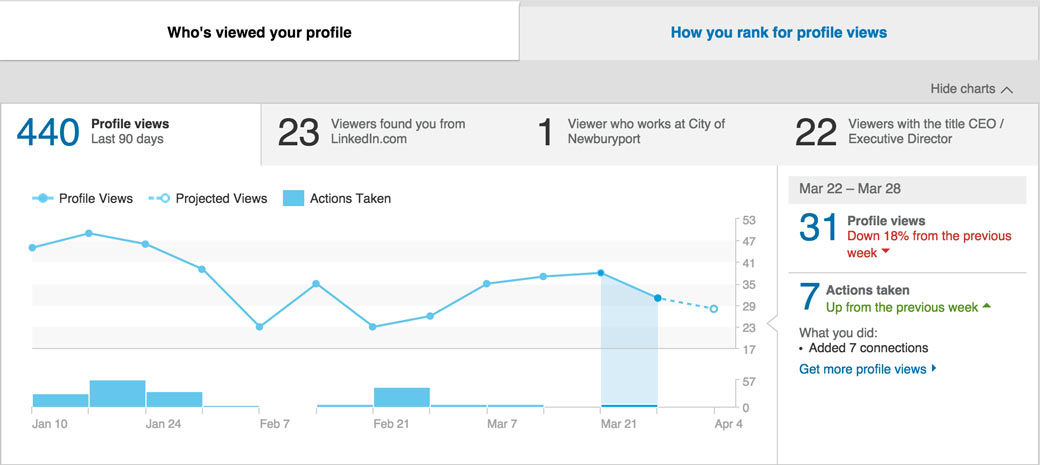
Premium users can see the full list of people who have viewed their profile. This feature can be useful if you are trying to connect with employers or business prospects—you can reach out to connect with people at a time when you know they are interested in you.
Company page owners can use the analytics tab on their page to get insights about their page posts, audience, and engagement. First, you will see detailed analytics about your latest page posts.
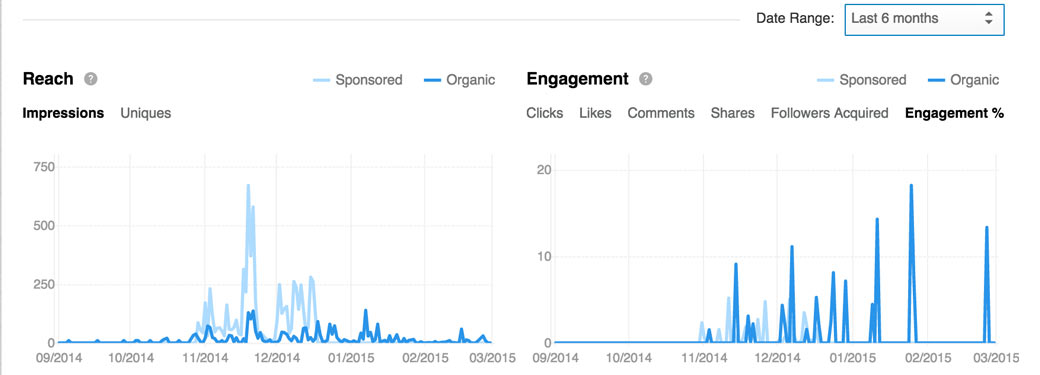
Next, you will see your page’s reach and engagement. These charts can be filtered to show impressions, unique impressions, clicks, likes, shares, comments, followers acquired, and overall engagement percentage.
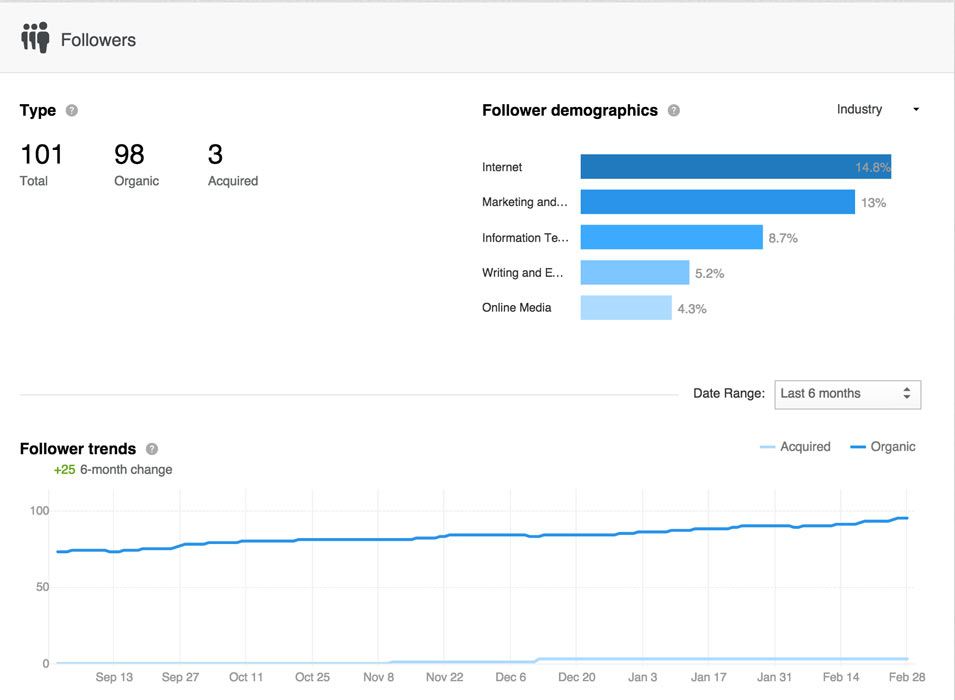
Beneath reach and engagement, you can learn more about your page followers. The dropdown next to Follower Demographics will allow you to browse the seniority, industry, company size, and function of your page followers. Use this to help determine whether you are promoting your company page to the right targeted audience on LinkedIn.
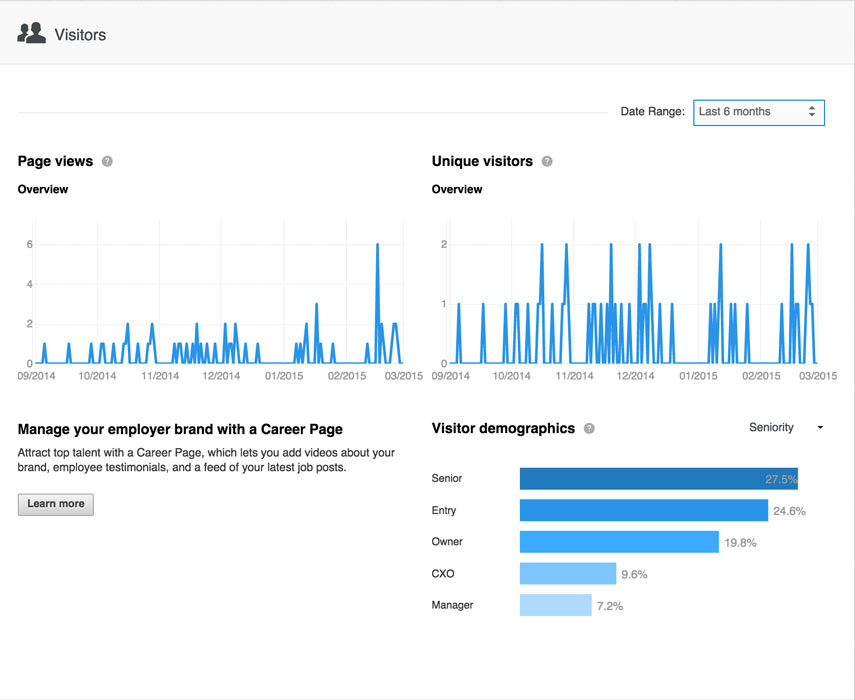
Finally, you have a similar section of data for visitors to your company page. This information will show you whether you are converting your ideal visitors into followers.
While LinkedIn has the least analytics data of the three largest social media networks (Facebook, Twitter, and LinkedIn), it does have enough to ensure that business owners know how well their profile, company page, and ads perform in order to get the most out of them.
Pinterest Business Account Analytics
Pinterest business account users can now review their Pinterest Analytics to learn more about their Pinterest presence. If you originally signed up for a personal account, you can convert your account to a business account to get access to this data.
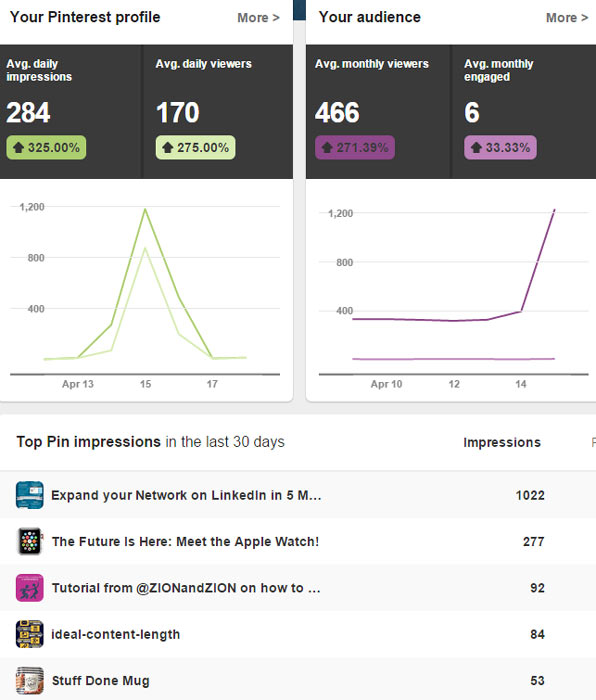
The first screen in your Pinterest Analytics will show you an overview of your profile, audience, and top pins.
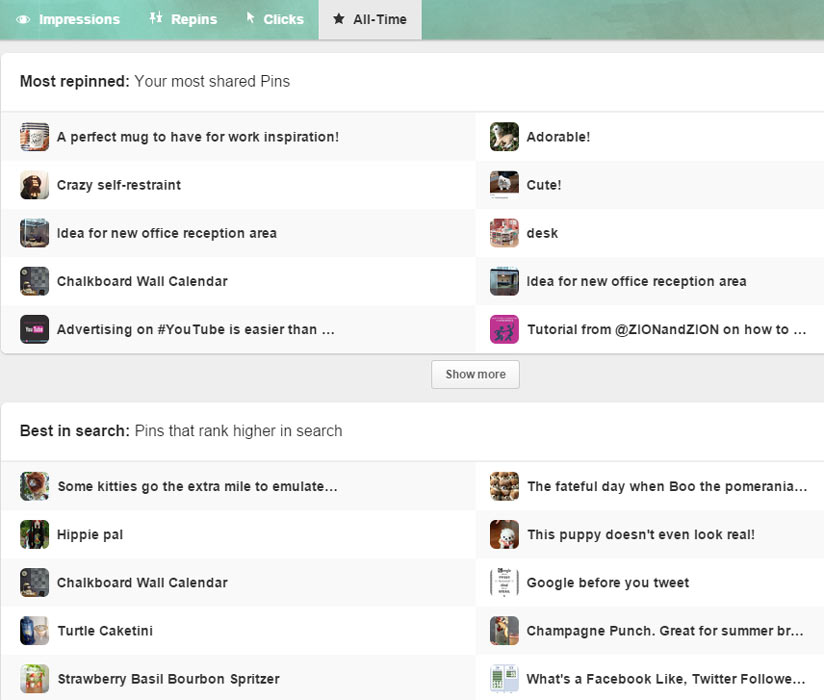
Under the Pinterest profile tab, you can click on the All Time tab to see your best pins based on repins, search traffic, and engagement.
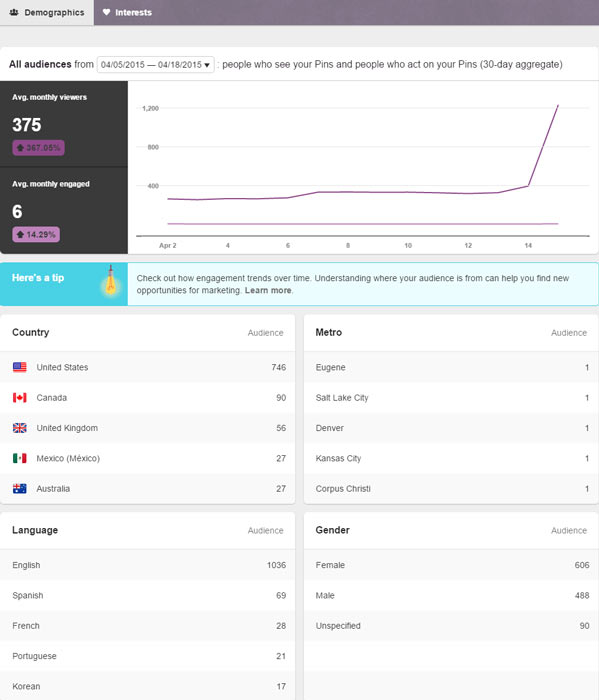
Under the audience tab, you can learn more about the basic demographics and interests of people who view and engage with your pins.
If you have a verified website linked to your Pinterest business account, you can view analytics data on pins created from your website.
For a business account, Pinterest Analytics can shed some light on your best performing pins and audience data. Once Promoted Pins rolls out, you can rest assured that analytics will be linked to those as well.
Instagram Business Analytics
Instagram will launch their own analytics system for businesses and brands in the not too distant future. It will provide insights on your Instagram audience and content performance.
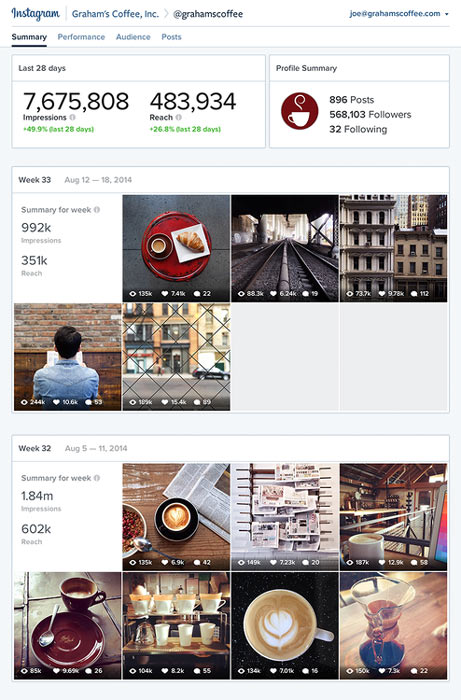
Until then, the only option for Instagram analytics will be third-party tools, such as Simply Measured’s Free Instagram Analytics Report for accounts with under 25,000 followers.
Third-Party Tools
Now, let’s look at a sampling of third-party tools you can use to interpret your social media data and extract additional data. We say “sampling” because there are hundreds of great social media analytics tools out there, and to cover all of them would be next to impossible! So instead we’ll cover tools that have a unique purpose, from measuring social media return on investment (ROI) to analyzing your competitors.
Google Analytics
If you are interested in finding out the ROI of your social media campaigns, Google Analytics can help. First, you will need to set up goals within Google Analytics; preferably goals with goal values to get a specific dollar amount.
Businesses that are measuring “lead form submissions” over “product purchases” may have a little more difficulty setting a dollar value, but will still be able to link conversions to social channels.
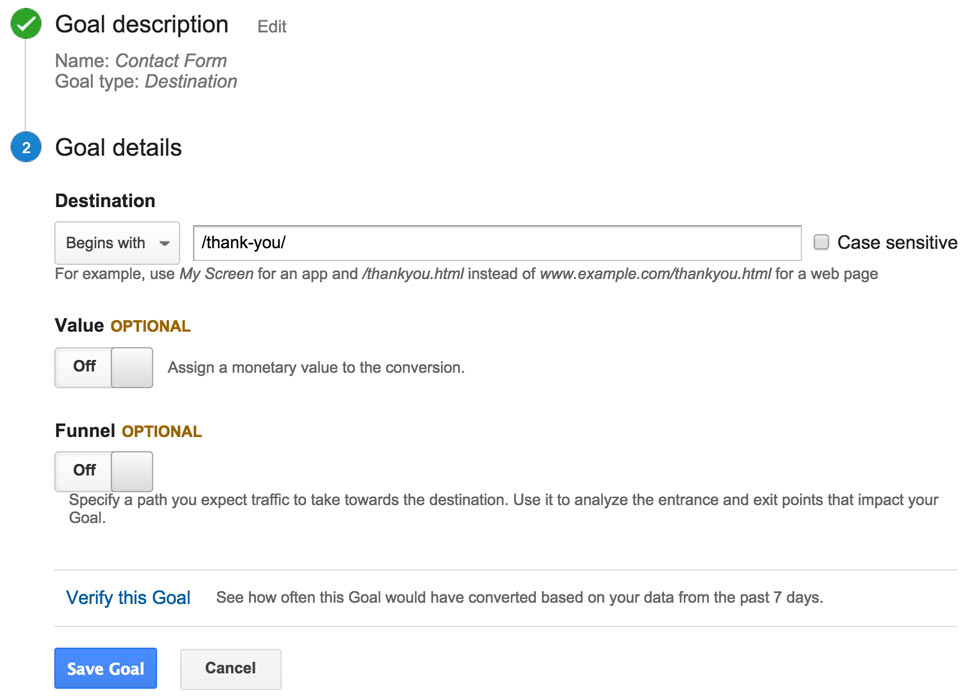
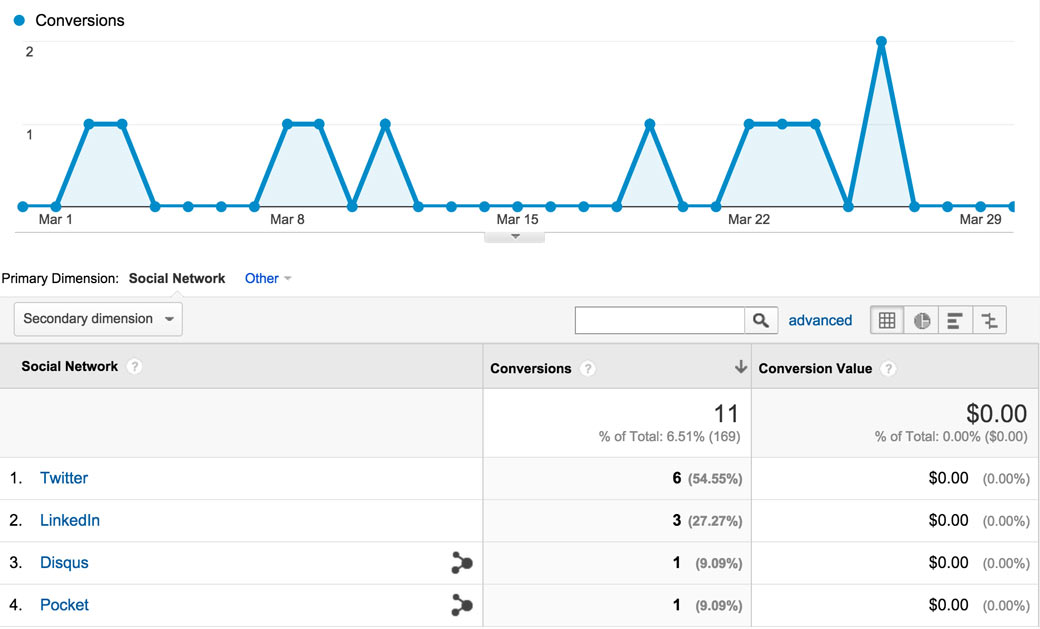
Once goals are set up in your Google Analytics, you can measure social media ROI in a number of ways. Start by going to the Social Conversions report under the Acquisition section to see which social media channels drive the most conversions.
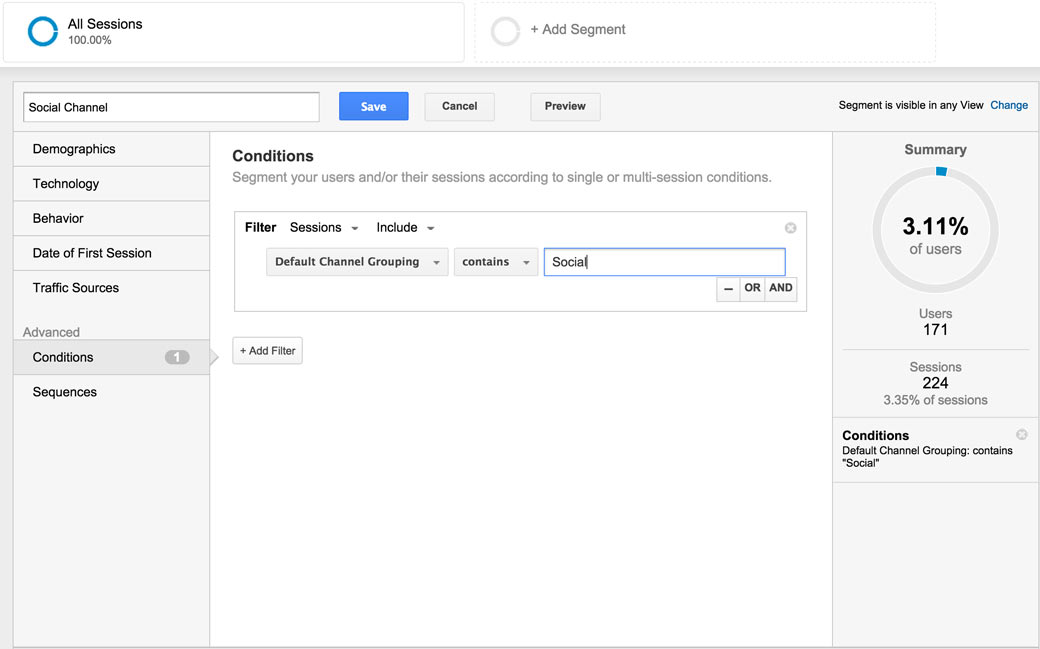
You can create a segment that will allow you to see all of your website’s Google Analytics data based on visitors from the social channel default grouping.
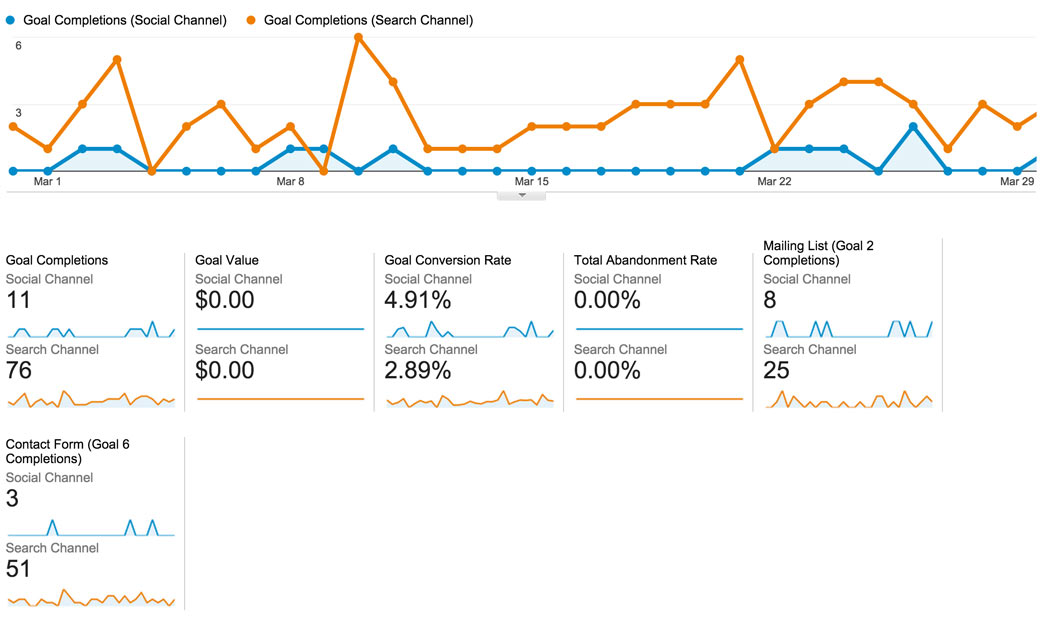
You can then browse the reports in the Conversions section to learn more about the conversions you receive from Social channel visitors. You can also create additional segments for other channels, such as Organic Search, to compare your conversions between each channel.
Using the Social channel segment you created, you can go to the Source/Medium report under the Acquisition section to see specific referral information about your social media traffic and conversions.
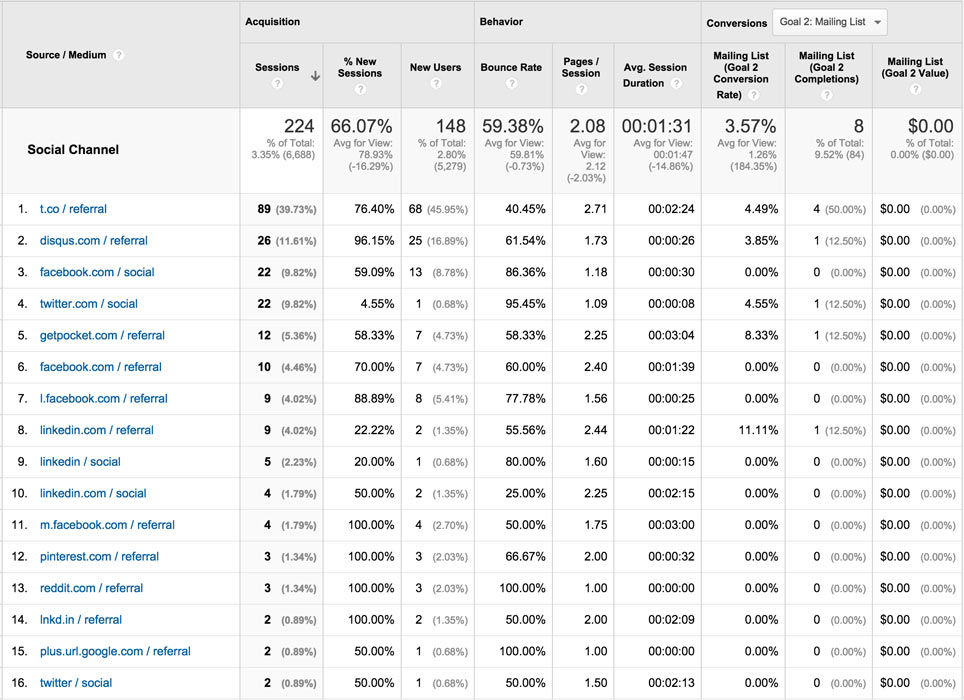
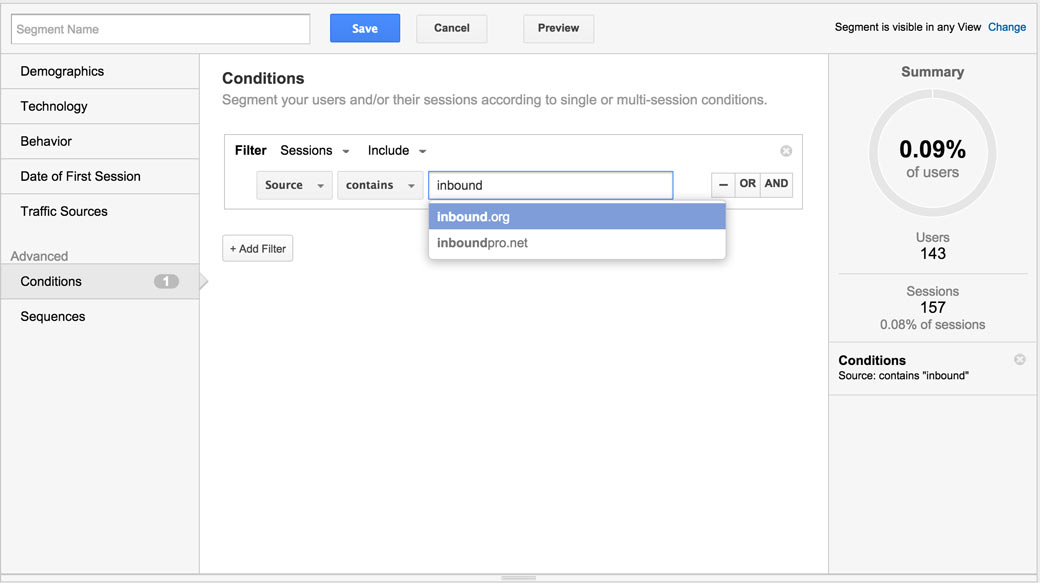
It’s worth noting that not all social networks are included in the Social channel grouping in Google Analytics. If you participate in niche social networks that don’t fall into the list of networks that Google Analytics considers social, you can add them to a separate Social Media segment.
In this segment, you will specify the domain of the social network as the source, such as social bookmarking networks. This will allow you to see a more detailed analysis of your social media conversions. If you’re not sure what social networks to add, you can refer to this list of social media networks or look at your own referral traffic report in Google Analytics to see which social networks appear, but are not listed as social.
If you only use one tool outside of the analytics provided by the social media networks themselves, it should be Google Analytics. Since you’re likely already using it, take a few moments to familiarize yourself with the social media reporting features. You’ll be glad you did!
Simply Measured
As mentioned earlier, Simply Measured offers a free collection of reports to help you analyze your social media usage. These reports are limited to Facebook pages with less than 250,000 likes, Instagram profiles with less than 25,000 followers, Google+ pages with less than 100,000 circlers, and Twitter accounts with less than 100,000 followers.
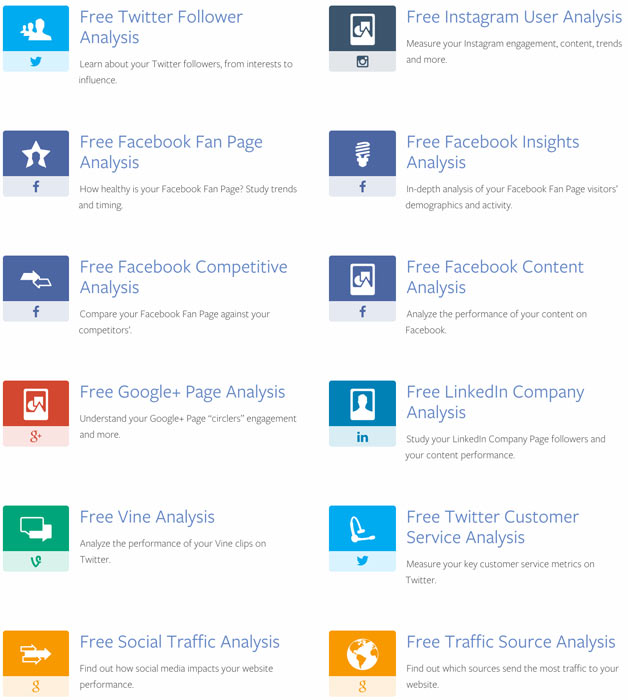
These reports will sometimes give you insights beyond what each social network provides in their own analytics tool, and they will help you visualize the data in new ways to understand it better.
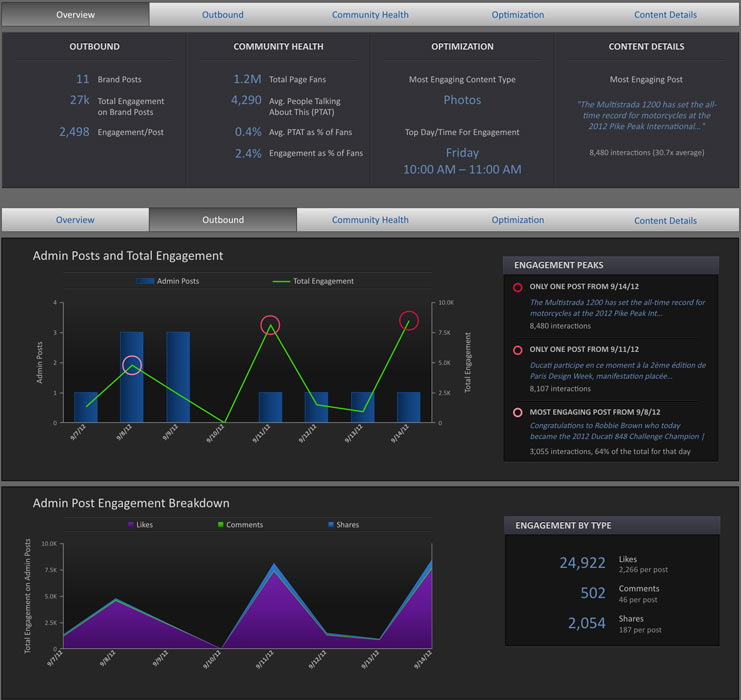
If you like the free reports but your audience is too large to use them, you can get more insights through Simply Measured’s platform, which starts at $600 per month.
SproutSocial
SproutSocial is a social media management tool that offers insights into your social media analytics. While the data is similar to what you would find in your official social network analytics, it is presented in a way that is easier to consume.
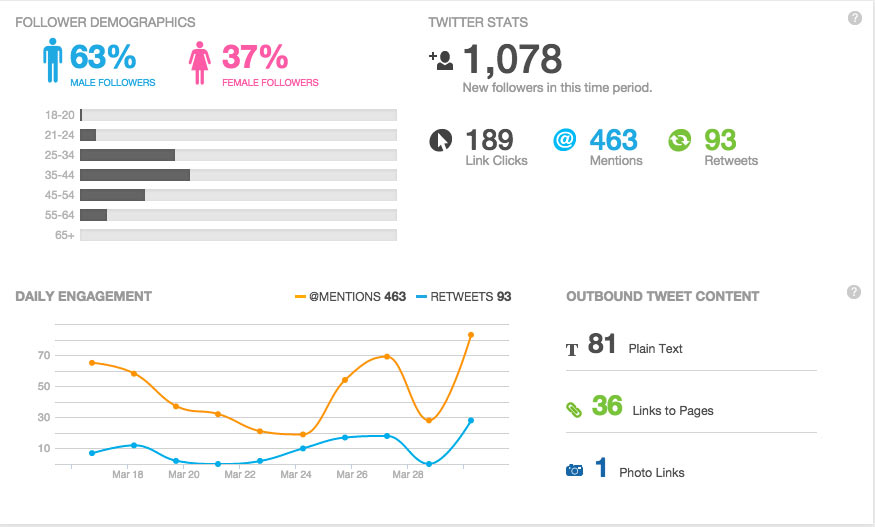
For example, you’ll find an overview report for your Twitter profiles.
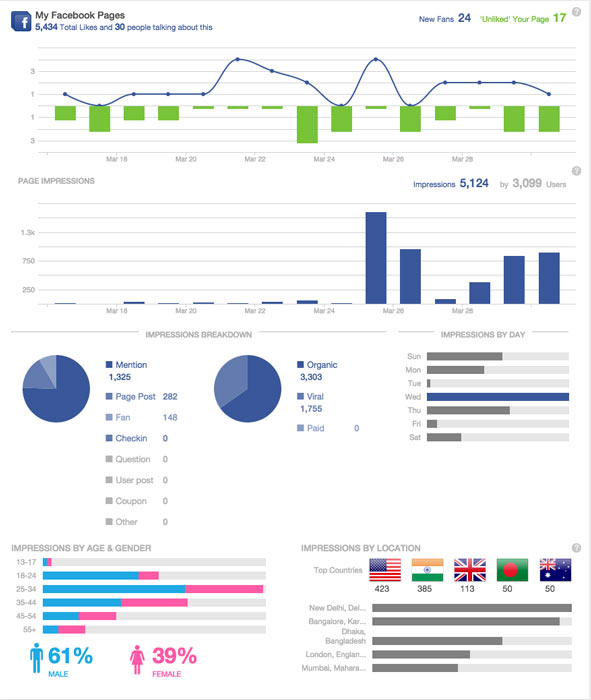
You’ll also find an overview report for your Facebook pages.
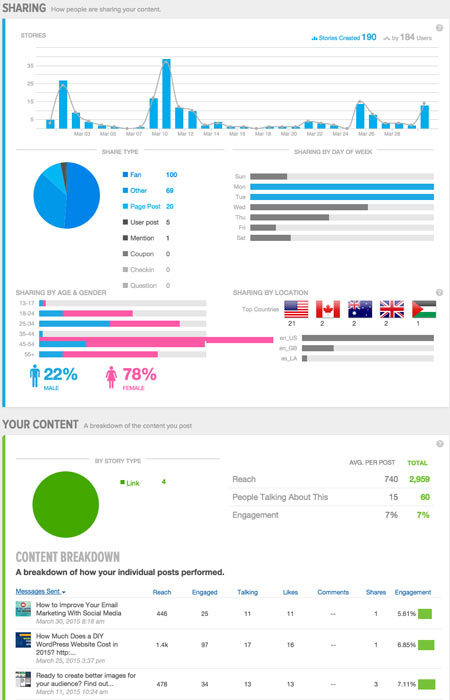
Click through each to find additional reports about your audience and engagement on both networks, such as Facebook sharing and content publishing.
With subscription options starting at $39 per month, SproutSocial is a budget-friendly tool for small to medium sized businesses who want a clear, one-page report for their primary social accounts.
Rival IQ
Want to analyze your competitors’ social data? This option is only available through third party tools like Rival IQ. Once you have entered your company along with your competitors, you’ll getan overview of your social media analytics along with theirs.
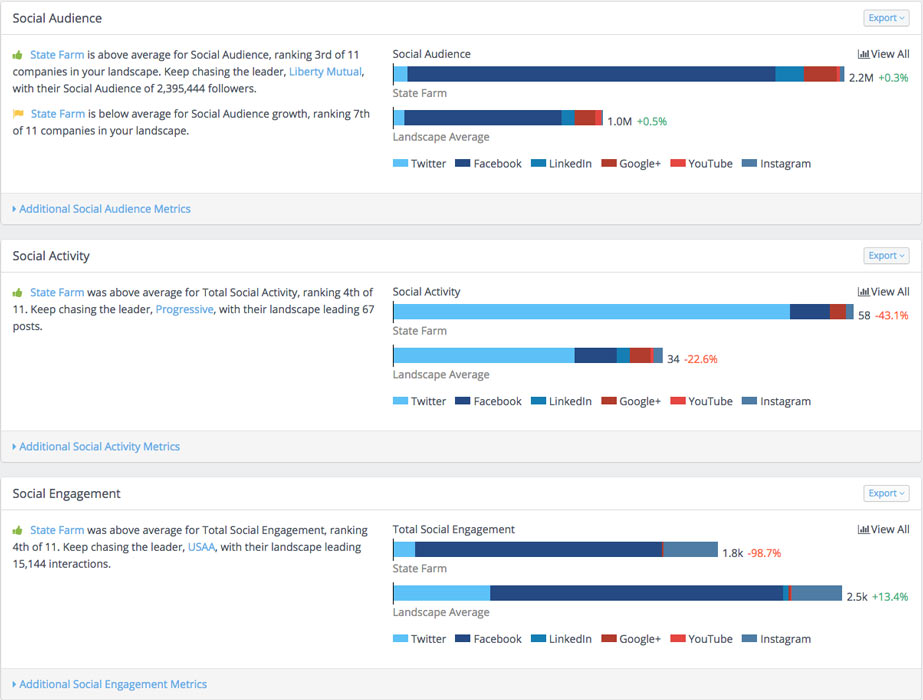
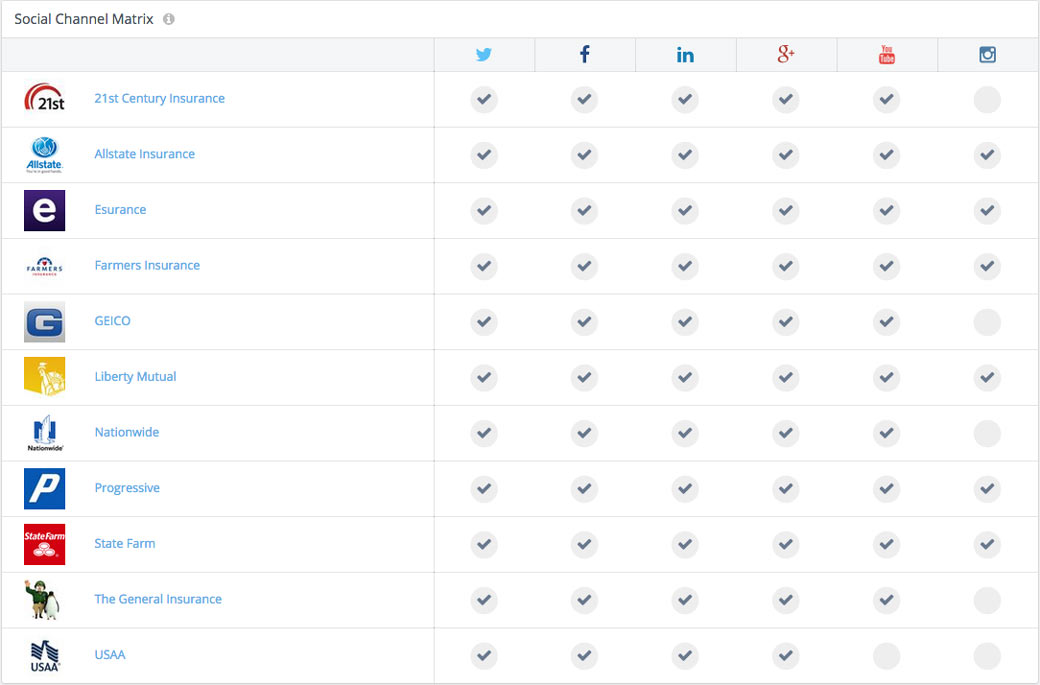
You can also see which social media channels your competitors are using.
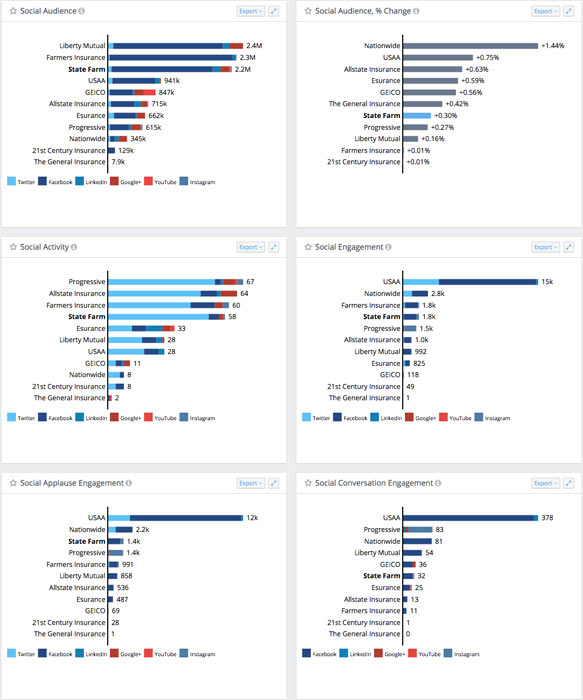
You can review an overview of your company’s and your competitors’ audience, activity, and engagement.
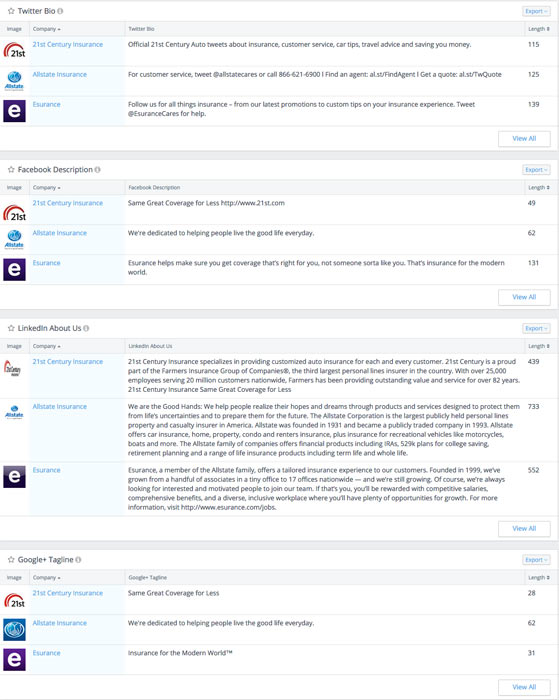
You can see how your company positions itself on top social networks, compared with your competitors.
You can then dive into reports detailing your company’s and your competitors’ audience, activity, and engagement on specific networks, such as a report on the most engaging content posted on LinkedIn company pages.
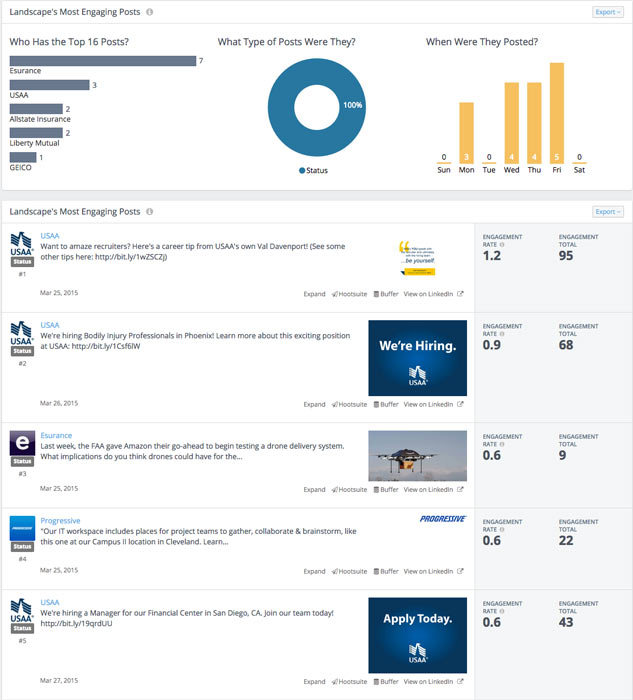
Overall, this tool will give you the analytics and insights into what is working for your company and your competitors, all in one place. You’ll find out what size audience you can expect on a particular network, what type of content gets the most engagement in your industry, and how to position yourself in a way that encourages your customers to choose you.
SocialBro
SocialBro is a platform dedicated to one social network. SocialBro provides in-depth Twitter analytics. You can start with a full breakdown of your Twitter profile, analyzing data about your followers, activity, and account engagement.
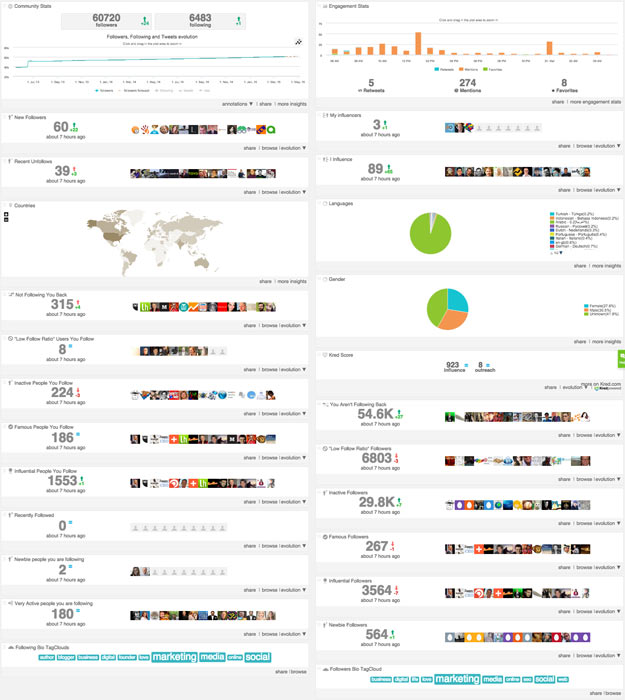
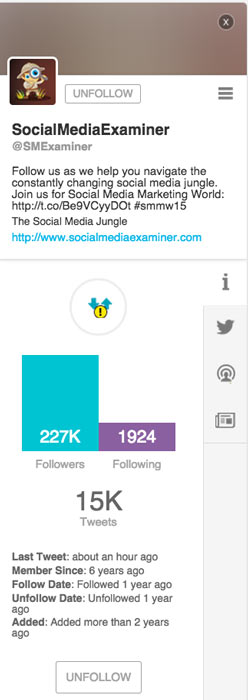
You can click on users throughout your report to see a quick summary of their profile data.
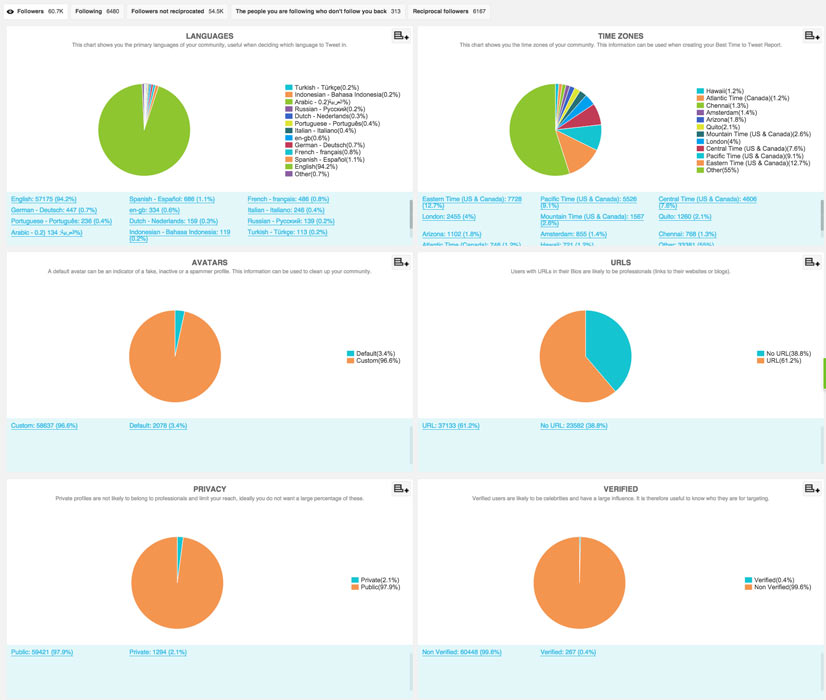
You can get some insights into your followers by analyzing the tag cloud for common keywords from your followers’ bios.

You can view detailed analytics about your followers, those you follow, and those who do or do not reciprocate your following.
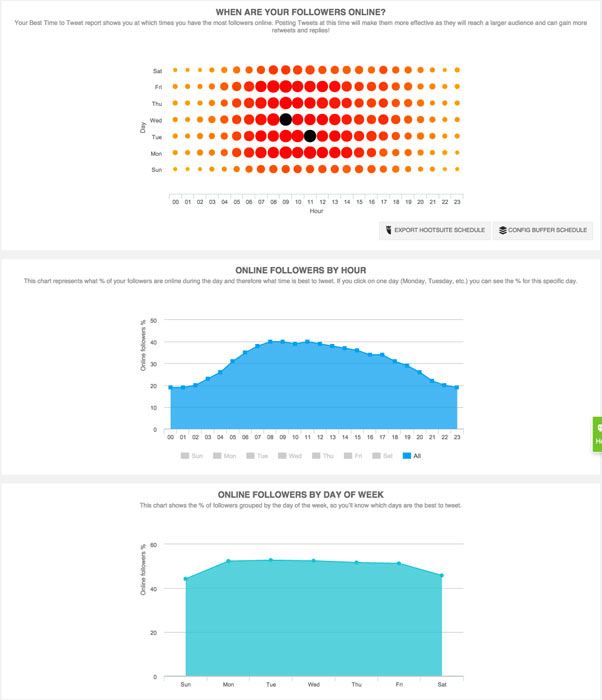
You can get a detailed analysis on the best days/times to tweet, based on your audience.
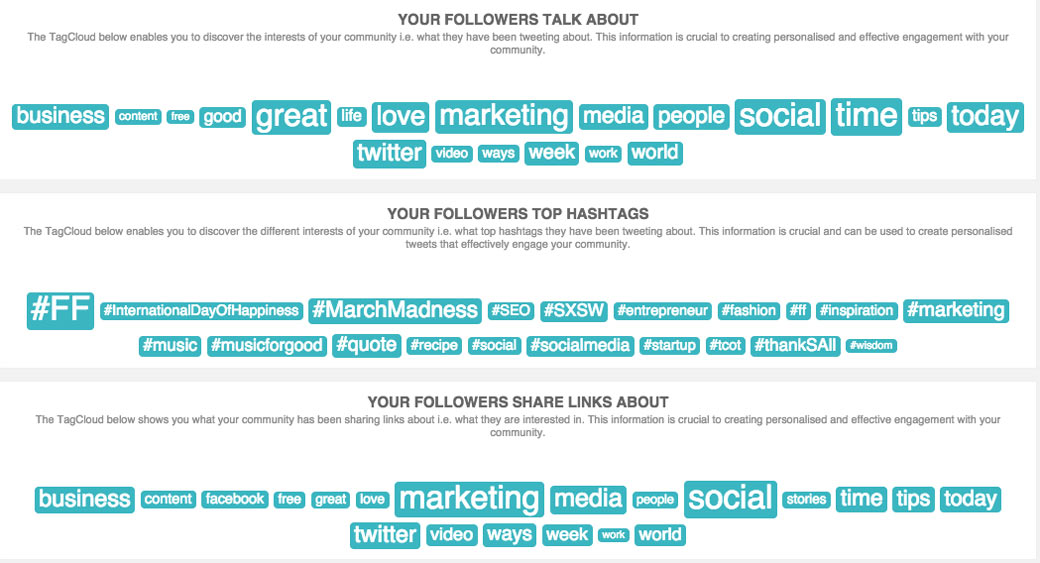
Beneath this data, you’ll see what your followers tweet about most often, based on keywords, hashtags, and links.
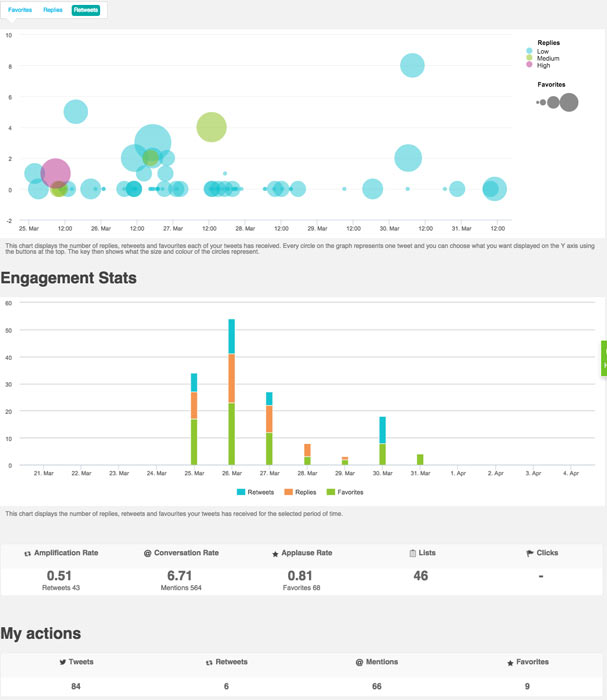
You’ll also find a detailed content analysis about the tweets that you share.
You’ll even find a real time report that tells you what your Twitter audience is doing now, down to the social media management tools they use.
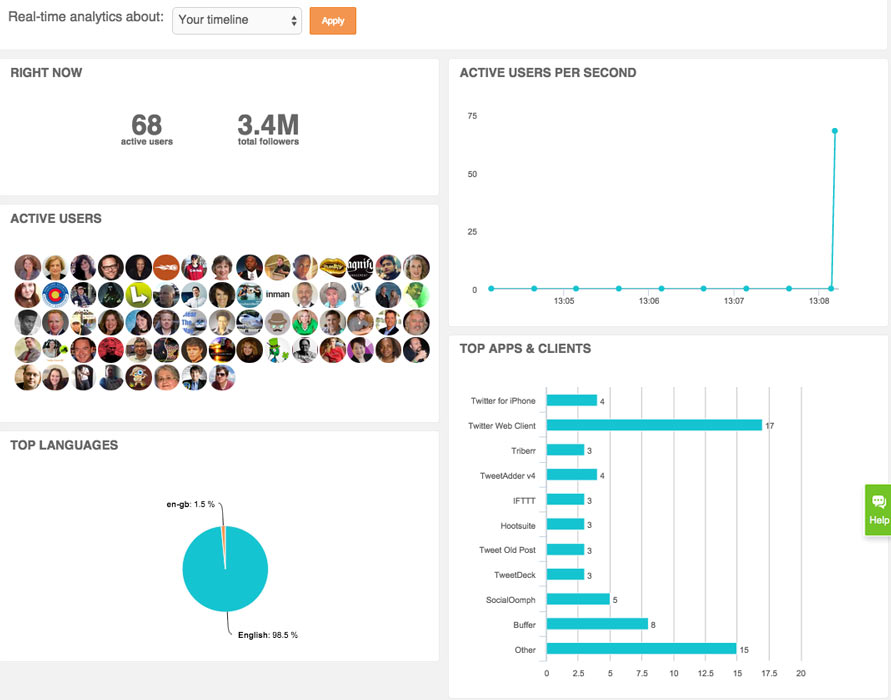
As you can see, platforms specific to one social network, such as SocialBro, can give you details about your social media presence that you won’t find anywhere else.
Cyfe
It may seem like getting analytics from your social media profiles and website means going from one place to the next. Fortunately, tools like Cyfe can simplify this process by allowing you to create dashboards with widgets of data from your top social networks.
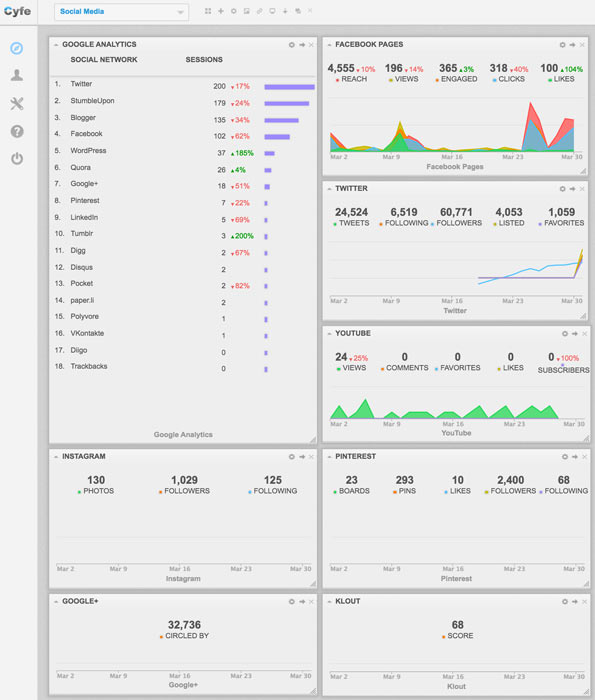
You can continue to add additional widgets that detail content performance and mentions of your business on Twitter.
If you manage more than one set of social media accounts for yourself or your clients, social media analytics dashboards will save you a substantial amount of time. You can even choose to have your dashboards emailed to you as a reminder to check your social media progress.
Oktopost
For those that share content across multiple social media networks, social media publishing tools like Oktopost can tell you which posts get the most engagement across multiple networks, including social groups.
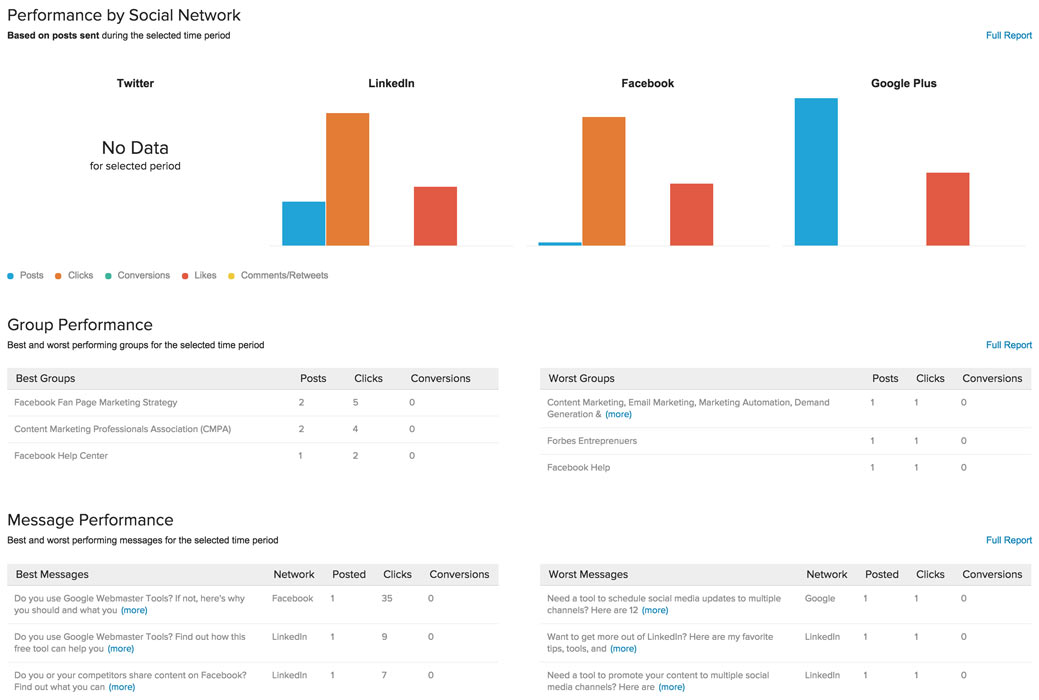
You can view each report in detail. They will tell you which pieces of content performed best amongst your social media audience, which social groups engage most with your content, and which social networks drive the most engagement to your content.
BuzzSumo
Social analytics goes beyond what is working on social media. Tools like BuzzSumo can give you social media insights that will help you improve your content marketing. Simply type in any topic to find the most socially shared articles on that topic.
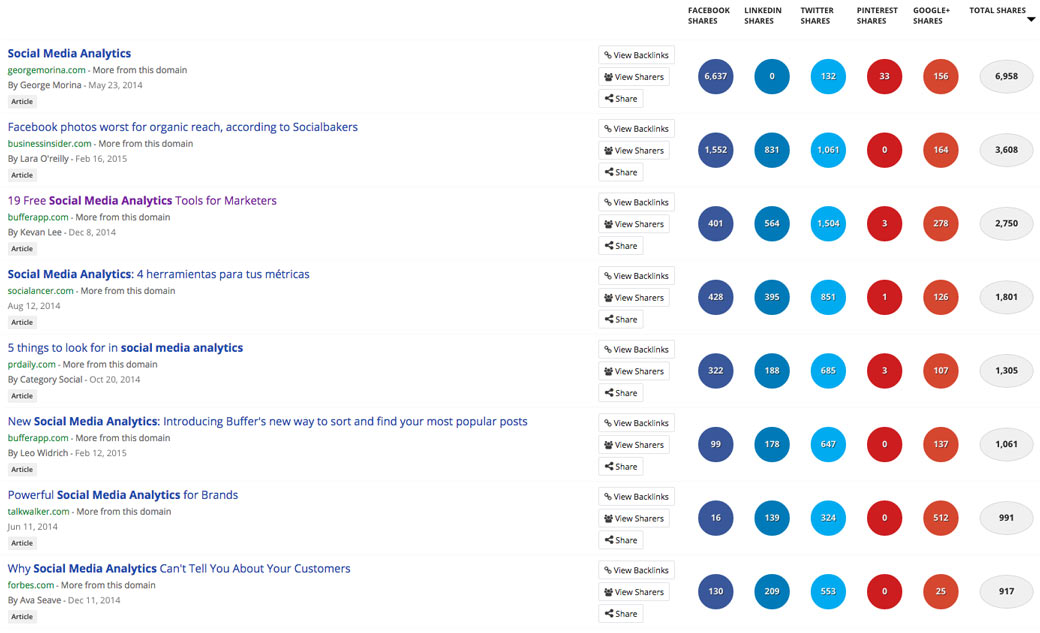
From here, you can click on the View Sharers button next to an article to see statistics on the people who shared each piece of content. It includes their page and domain authority for the URL in the user’s bio, number of followers, retweet ratio, reply ratio, and average retweets generated by the user.
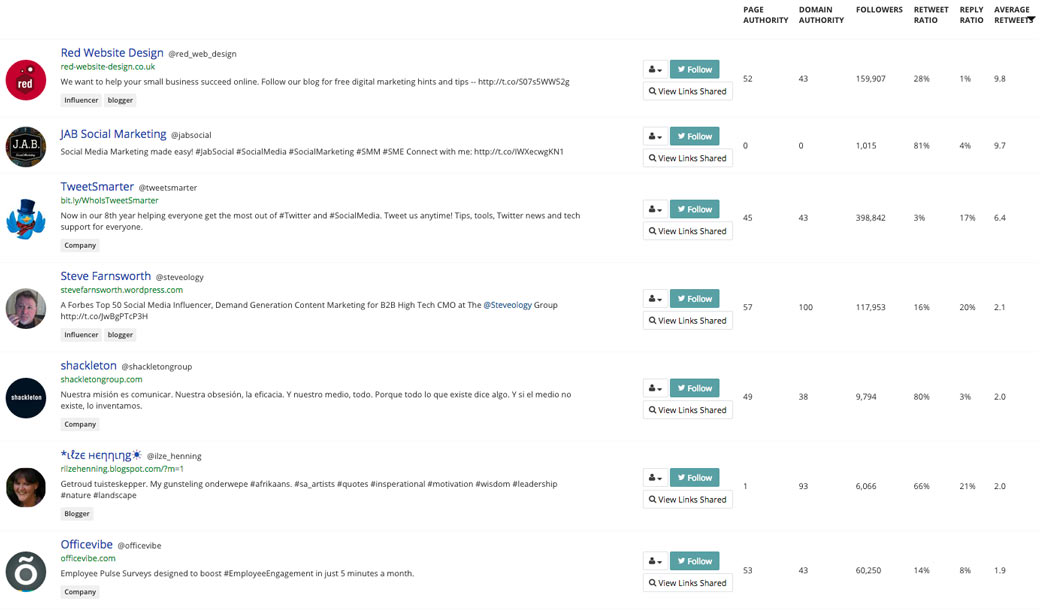
So in addition to learning more about the content that works best on social media in your industry, you can find the best influencers to connect with who will (potentially) share your content.
Conclusion
Between the analytics provided by social networks and third-party tools, there is a wealth of data you can use to determine the success of your social media marketing campaign. These tools can help you determine if your audience is growing at a desired rate, if your content is reaching your desired audience, if your desired audience is engaging with your content, and if you are doing as well as your competitors. You can also use social media analytics to help with other areas of your online marketing, such as content strategy.
The key is to figure out which analytics tool helps you learn the most about your social media presence, or helps you achieve your goals—and stick with it. If you find that you can get exactly what you need from Facebook Insights, then you don’t want to subscribe to six other tools that might confuse you, or make you spend more time on analytics than needed! If you find that you need your social analytics displayed in a different format, then a third-party tool might be best.
Most third-party tools allow you to try their platform for free. Take advantage of these free trials by connecting your primary social accounts and diving into the software. And be sure to set aside enough time to do so! Then you will be able to determine if it’s the right tool for your business’ needs.
