Improving PPC Performance
In the interest of continuous improvement, we had our digital strategy team propose a new landing page for Plumbing Masters’ online marketing. The new landing page went through our standard development process consisting of research, wireframing, mockups and development. Both the new page (Page B) and the existing page (Page A) used responsive design to ensure that tablet and smartphone users had experiences tailored for those devices.

While many landing page tests focus solely on conversion as a percentage of visitors, we instead focused on a variety of business outcomes in order to gain a comprehensive picture of how the new landing page was impacting the client’s business. The items evaluated consisted of the following:
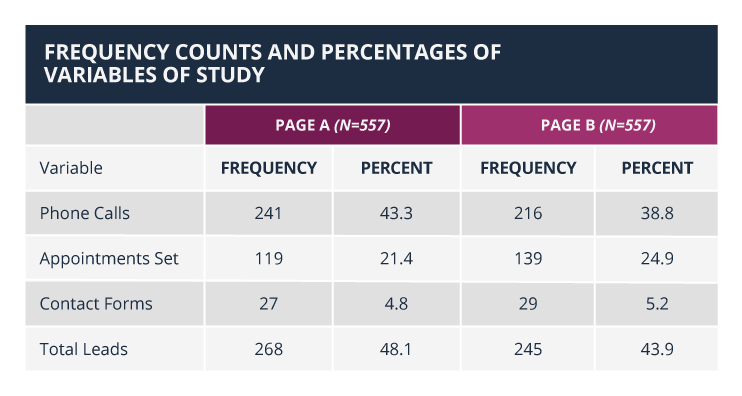
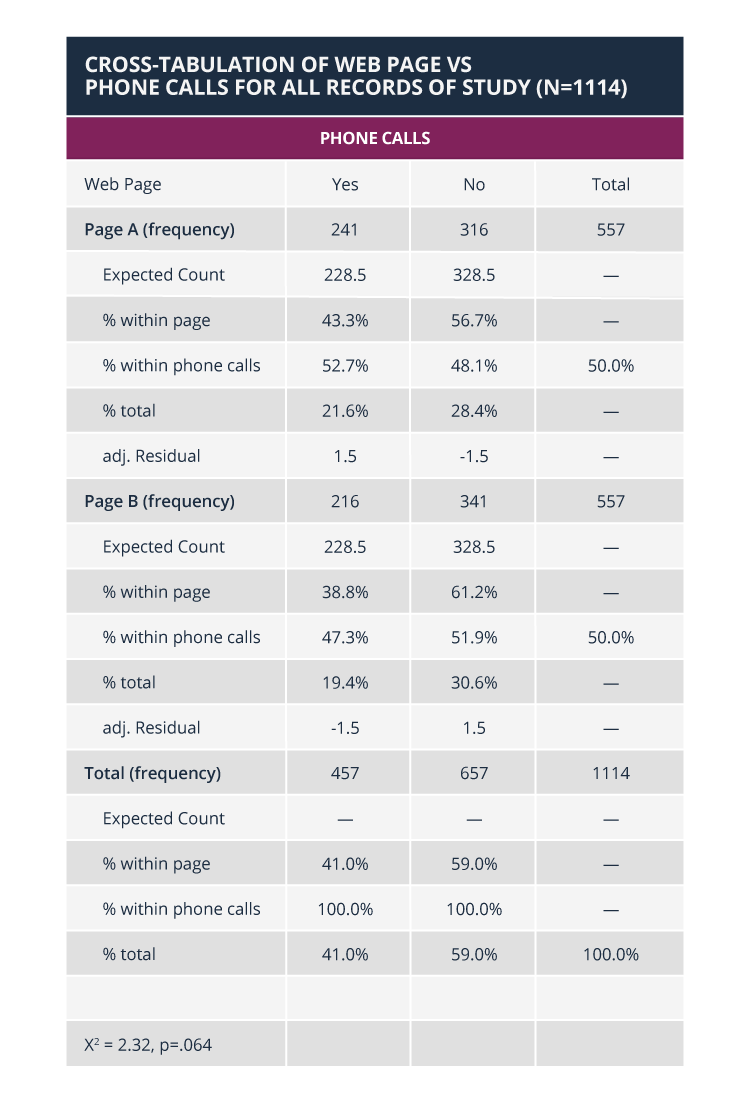
- Number of Phone Calls
- Number of Appointments Set
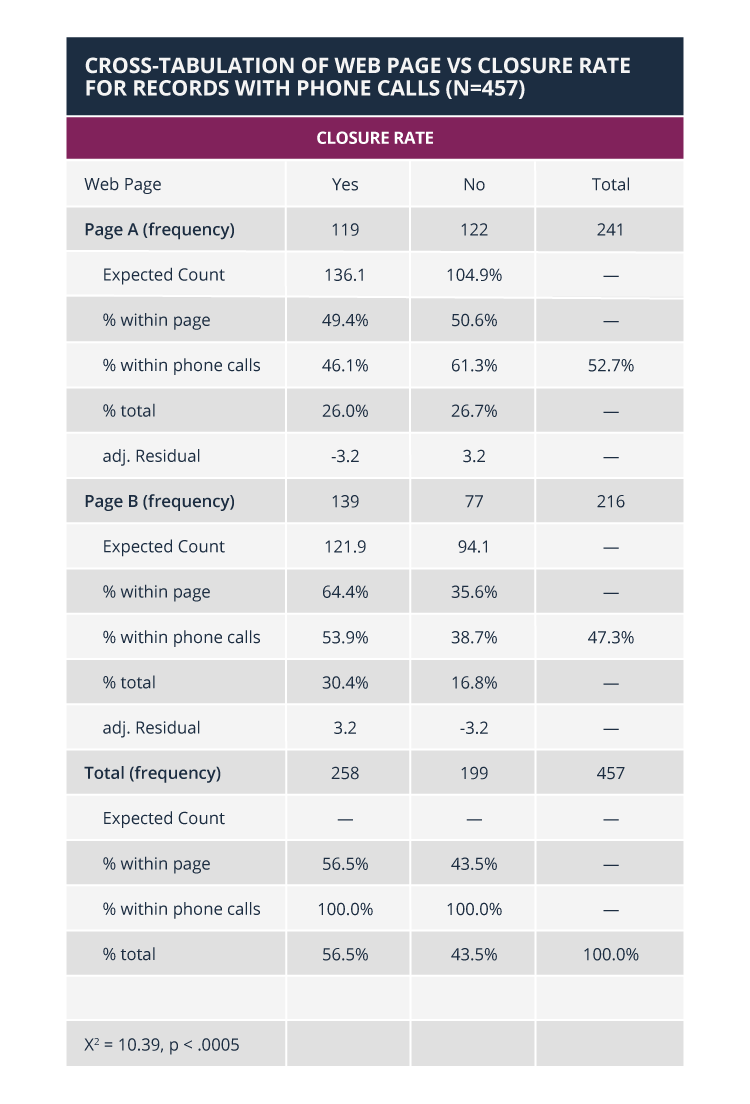
- Closure Rate
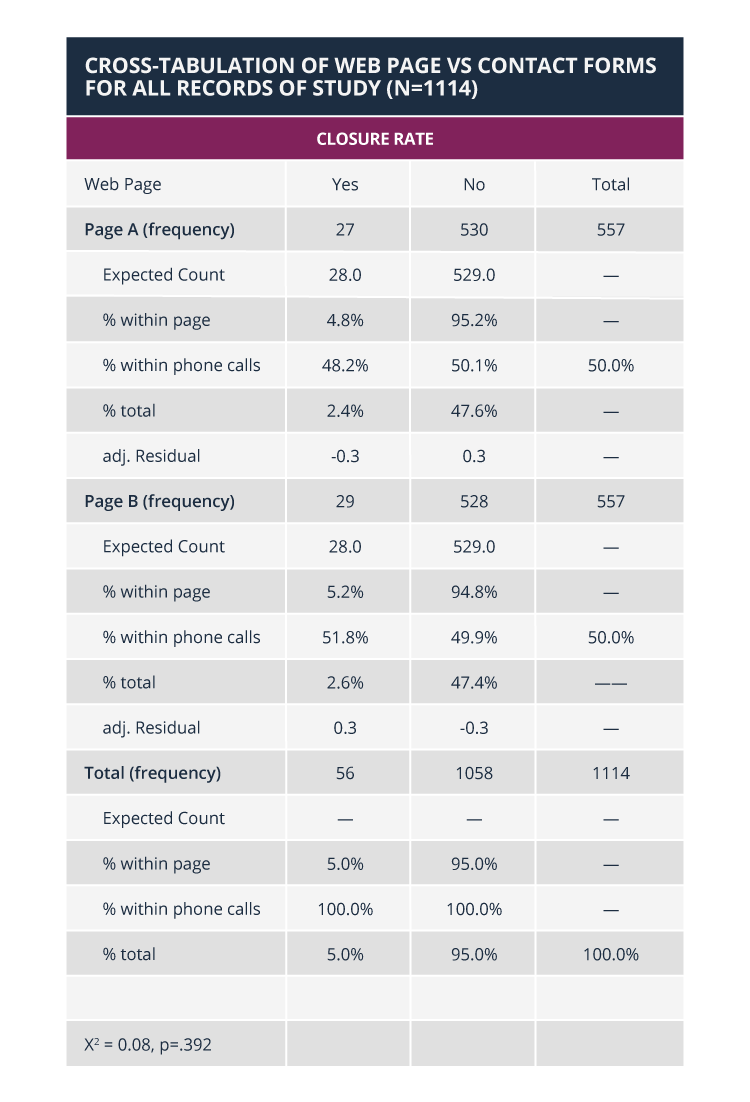
- Number of Contact Forms
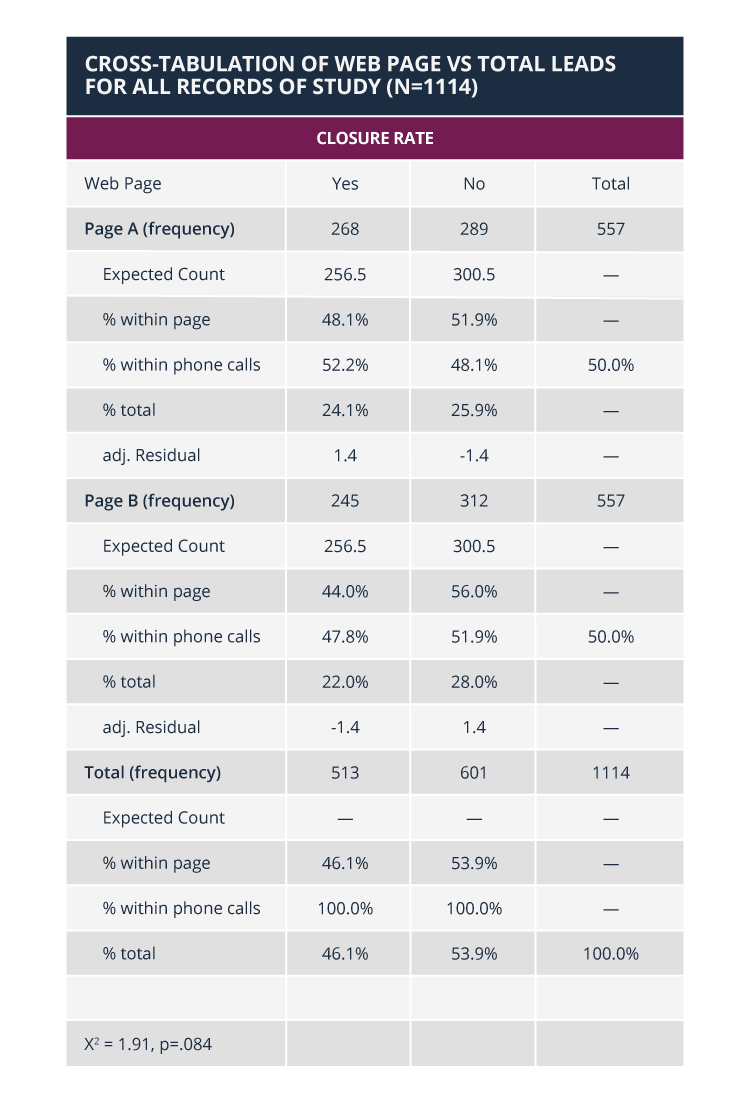
- Total Leads
- Average Transaction Size
An explanation of these business outcomes and their place in the client’s business model is as follows. Potential customers perform a search for a relevant keyword. They then see the client’s paid search ad. Some of them then click through to the landing page. Once on the landing page, they do one of three things. One, they do nothing at all. Two, they call the client via the tracking phone number that is on the landing page. Three, they fill in a contact form on the landing page. The client then sends a plumbing technician out to the home or business of each customer that has an appointment. Those appointments then turn into a sale or they don’t. Definitions of each of the six items evaluated are as follows:
- Item A is the Number of Phone Calls that the client’s call center receives.
- Item B is the Number of Appointments Set from the phone calls in Item A.
- Item C is the Closure Rate for the phone calls in Item A—i.e. the percentage of the time that a phone call turns into an appointment.
- Item D is the Number of Contact Forms that the client receives
- Item E is the Total Leads, defined as the total number of all of the phone calls in Item A (i.e. not just the ones that turned into appointments) and the number of contact forms in Item D.
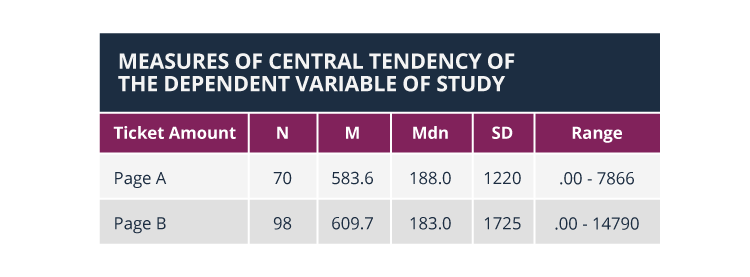
- Item F is the Average Transaction Size—i.e. the average of all of the sale dollar amounts for every appointment that the client’s technicians go out on, including the appointments that result in zero dollars.
Chi-square tests were performed for Items A through E and a t-test was performed for Item F, with the hypotheses being that the new landing page, i.e. Page B, would perform better than the existing page, i.e. Page A. Because of the directionality of our hypotheses, a one-sided statistical test was appropriate, and our hypotheses are correctly phrased as follows:
- HA: Page B will generate a greater proportion of Phone Calls as a percentage of visitors to the page than Page A
- HB: Page B will generate a greater proportion of Appointments Set as a percentage of visitors to the page than Page A
- HC: Page B will have a higher Closure Rate for the phone calls that Page B generates than Page A will have for the phone calls that Page A generates—i.e. Page B will be better than Page A at generating phone calls that wind up turning into appointments
- HD: Page B will generate a greater proportion of Contact Forms as a percentage of visitors to the page than Page A
- HE: Page B will generate a greater proportion of Total Leads as a percentage of visitors to the page than Page A
- HF: Page B will generate a higher Average Transaction Size than Page A
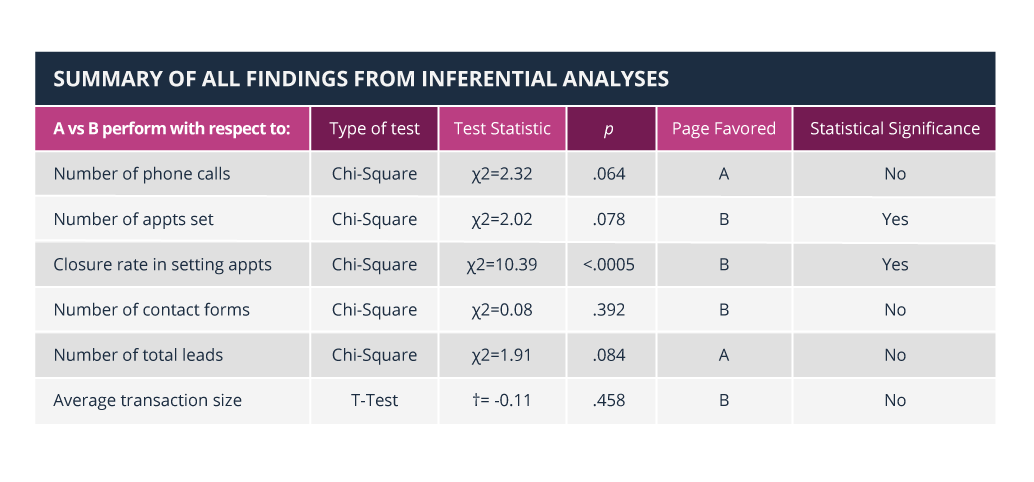
A detailed statistical analysis can be found farther down in this write-up, however a summary of the results is as follows.
- Page A converted 12% better than Page B with a confidence level of 94% that Page A would improve on the number of phone calls made over Page B. This result was not statistically significant since the hypothesis was phrased in favor of B and this was a one-sided test.
- Page B converted 17% better than Page A with a confidence level of 92% that Page B would improve on the number of appointments set over Page A. This was statistically significant (p < .10).
- Page B converted 30% better than Page A with a confidence level of 100% that Page B would improve on the number of proportion of appointments set from phone calls over Page A. This was statistically significant (p < .10).
- Page B converted 7% better than Page A with a confidence level of 61% that Page B would improve on the number of contact forms over Page A. This was not statistically significant.
- Page A converted 9% better than Page B with a confidence level of 92% that Page A would improve on the number of leads over Page B. This result was not statistically significant since the hypothesis was phrased in favor of B and this was a one-sided test.
- Although Page B had a higher mean transaction amount than Page A, i.e. $609.72 for Page B vs. $583.59 for Page A, the difference was not statistically significant.
Since the primary goal of the new landing page is to maximize ROI, the landing page test can be declared a success. Since both Page A and Page B had the same amount of traffic and incurred the same amount of cost to generate that traffic, the fact that Page B resulted in a greater proportion of appointments set (with statistical significance) means that Page B was the appointment setting winner. Page B also used the time of phone answering personnel more efficiently since a greater percentage of the incoming calls were converted to appointments when the calls came from Page B than when the calls came from Page A. And while Page B did have a higher average transaction size, this result was not statistically significant, but even if Page A and Page B have the same (from a statistical standpoint) average transaction size, Page B is still also the winner from a revenue perspective.
Note that Appointments Set only includes the appointments that were able to be matched to calls coming through the call tracking system by doing a match on the caller ID in the call tracking system and the phone number that the caller verbally provided to the customer service rep that was setting up the appointment. This causes a loss of data, but the loss should exhibit no exclusion bias since this occurred randomly in the case of both Page A and Page B as both pages were rotated in real-time.