
Overview
While a company measuring its Net Promoter Score (NPS) is certainly better than having no customer metrics, the Strategy & Analytics team here at Zion & Zion has identified multiples issues with the NPS, ranging from statistical to practical, that have not been identified elsewhere. Our hope is that this article will further enlighten and assist those currently using the NPS or contemplating the use of NPS. Of particular interest in this article is the fact that we highlight errors in the statistical claims of the NPS’ relationship to growth.
Background
Originally developed by Frederick Reichheld, Bain & Company, and Satmetrix, the Net Promoter Score (NPS) was first published in the December, 2003 issue of Harvard Business Review in an article entitled “The One Number You Need to Grow.” The NPS is calculated by calculating the percent of an organization’s customers that are “Detractors” and subtracting that from the percent of an organization’s customers that are “Promoters.” The details are as follows:
- Ask respondents the question “How likely is it that you would recommend [company X] to a friend of colleague?”
- Have respondents provide their answers on an 11 point scale, coded zero to ten, where zero represents “not at all likely,” five represents “neutral,” and ten represents “extremely likely.”
- Calculate the percentage of “Promoters,” i.e. count the number of respondents answering the question with a nine or a ten as a percentage of the total respondents to the question.
- Calculate the percentage of “Detractors,” i.e. count the number of respondents answering the question with a six or less as a percentage of the total respondents to the question.
- Subtract the percentage of Detractors from the percentage of Promoters. The result is the NPS. Note that we ignore those respondents (referred to as “Passives”) answering the question with a seven or eight.
NPS: Previous Criticism
Previous criticism and cautionary statements regarding the NPS include: inconsistencies in Reichheld’s arguments over time; the insufficiency of a single metric (i.e. the NPS); the lack of explanatory power of consumer likelihood to recommend (Grisaffe 2007); cultural insensitivity (Evensen 2011); and statistical inaccuracy of claims of the superiority of NPS over the ACSI (American Consumer Satisfaction Index) (Keiningham, Cooil, Andreassen, and Aksoy 2007).
NPS: Issues Not Previously Identified
In addition to the numerous issues with NPS that have already been pointed out by others, academics and practitioners alike, this article highlights several additional issues uncovered by the Strategy & Analytics team here at Zion & Zion that have significant management implications.
A Lack of Statistical Significance in the Original NPS Data
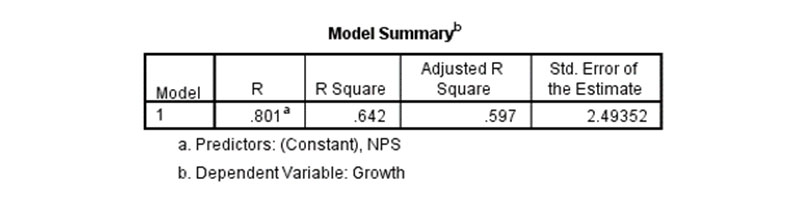
Shown here is data from Reichheld’s original 2003 Harvard Business Review article that launched the NPS phenomenon. Specifically, you’ll see data on the airline industry, data on internet service providers, and data on rental car companies. These graphs relate each company’s NPS score to its three-year growth rate. We reverse engineered the graphs to extract the data points, and ran our own regression analysis on each industry’s data.
For the airline industry, we found an R Square 0.642 (i.e. 64.2% of variance in growth is explained by the NPS), and we see statistical significance, p-value 0.005. And while this seems be a major win for the NPS, the data for the other two industries that Reichheld highlights in his 2003 HBR article contradict the NPS-to-growth relationship.
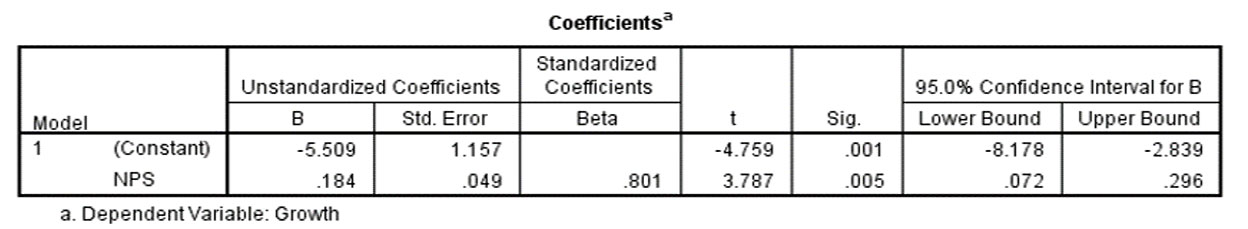
Specifically, even though Reichheld physically overlays a thick white band on his graph meant to communicate a proven relationship between NPS and growth for the ISP market, our regression analysis shows that the data is not statistically significant (p-value of 0.189).
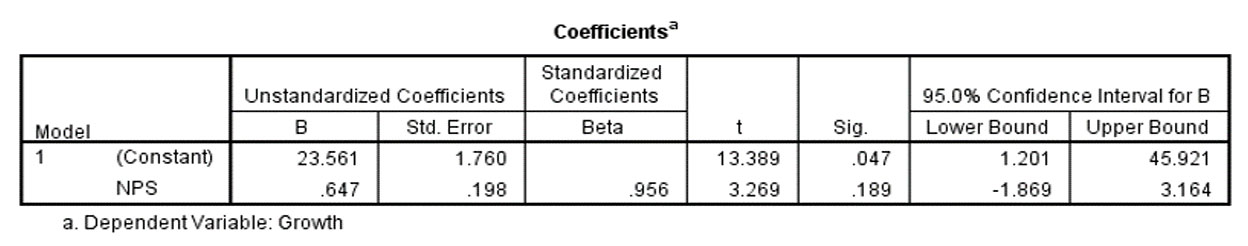
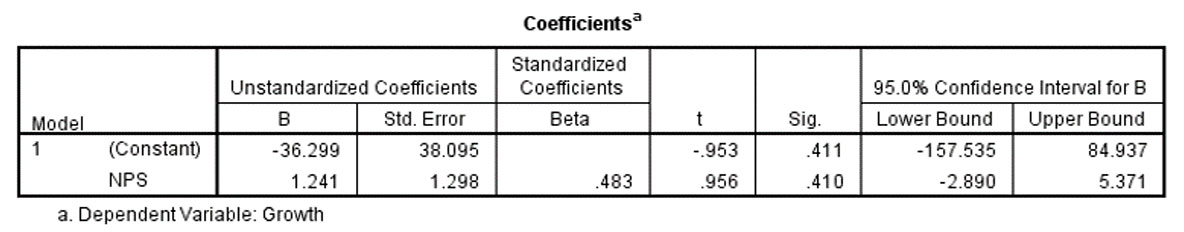
The situation is dramatically worse when Reichheld’s rental car industry data is examined. In this case, he attempts to force the perception of a strong NPS-to-growth relationship by overlaying an exceptionally thick white band on the graph. Our regression analysis highlights the deficiencies in the relationship. Here the R Square is 0.233 and the p-value is 0.410.


NPS Implies that Incremental Improvements in NPS Drive Incremental Improvements in Growth Rate
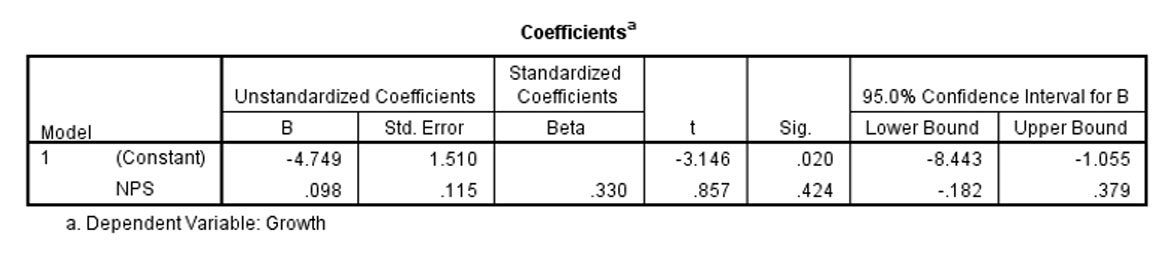
In aggregate, for some industries, there is a statistically significant relationship between NPS and growth, however, this is only true in aggregate—i.e. the relationship does not hold for “sub-ranges” of the data, which means that it doesn’t apply to many of the companies in the data set. For example, Reichheld examines ten airline industry data points. And indeed, the data is statistically significant (p-value of 0.005) with an R Square of 0.642. This would suggest to an airline a strong relationship between NPS and growth. However, upon closer inspection and statistical analysis, our research team found that the relationship only exists because of two dominant data points, namely Alaska Airlines and Southwest Airlines. To clarify, when those two airlines are removed from the data set, the R Square drops to 0.109 and is not statistically significant (p-value of 0.424). At best, this suggests that incremental improvements to an airline’s NPS have no sizeable, statistically significant effect on growth and that improvements in NPS would have to be dramatic to impact growth.

NPS Loses Statistically Significant Information Related to Customer Service Improvements
The NPS does not measure many improvements related to customer recommending behavior (e.g. changing a person from a zero to a six on the NPS scale shows no difference in NPS). This is similar to the “information loss” concerns that other authors have expressed, but most of those concerns are related to statistical power, while we are focused on the operational consequences of not acknowledging incremental satisfaction improvements. To argue, as the NPS does, that a person rating a particular company with a six will result in the same recommending behavior as that person rating that same company with a zero lacks face validity.
The NPS Treats the Impact Magnitude of Promoters and Detractors as Equivalent
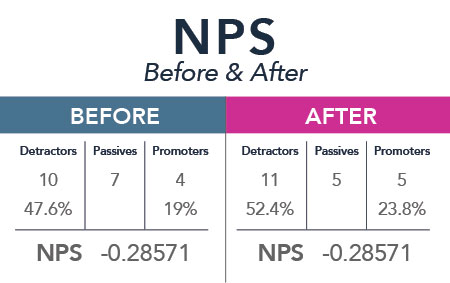
The NPS models the negative impact of a Detractor as having the exact same magnitude as the positive impact of a Promoter. A substantial body of academic research supports our contention that the effect of a positive review and that of a negative review are not the same. Specifically, the literature on response to positive vs. negative information applies (Anderson 1965; Cacioppo, Gardner, and Berntson 1997; Fiske 1980; Peeters & Czapinski 1990; Taylor 1991). In general, people’s negative reactions to negative information outweigh their positive reactions to positive information. Therefore a company that causes, as an example, some number of their Passives to become Promoters and an equal number of their Passives to become Detractors, will have the exact same NPS score that they did before the change occurred (see exhibit I), but research shows that the impact of the additional Detractors outweighs the impact of the additional Promoters.
It takes multiple bricks to build a wall
The focus on the NPS as “the one number” does not mean that a combination of metrics wouldn’t explain more variance and yield additional statistically significant independent variables. It simply means that Reichheld and colleagues said to themselves, if I could have one measure, which would it be. But that is akin to wanting to build a wall and saying if I could have one brick, which would it be. The answer is insufficient to address the problem of building a wall. Multiple bricks are needed. This fact, combined with other research on ACSI being a better predictor of growth than NPS (Keiningham, Cooil, Andreassen, and Aksoy 2007) and combined with the regression analyses that we’ve conducted highlight the need for extreme caution and skepticism when using and relying upon the NPS.
REFERENCES
Anderson, N. H. (1965), “Averaging Versus Adding as a Stimulus-Combination Rule in Impression Formation,” Journal of Personality and Social Psychology, 2, 1-9.
Cacioppo, J. T., W.L. Gardner, and G. G. Berntson (1997), “Beyond Bipolar Conceptualizations and Measures: The Case of Attitudes and Evaluative Space,” Personality and Social Psychology Review, 1, 3-25.
Evensen, Richard (2011), “Stop Using NPS (Net Promoter Score) But Please Save The Question!,” Forrester Blog, (April 18, 2011).
Fiske, S.T. (1980), “Attention and Weight in Person Perception: The Impact of Negative and Extreme Information,” Journal of Personality and Social Psychology, 38, 889-906.
Grisaffe, Douglas B. (2007), “Questions about the Ultimate Question: Conceptual Considerations in Evaluating Reichheld’s Net Promoter Score (NPS),” The Journal of Consumer Satisfaction, Dissatisfaction & Complaining Behavior, 20, 36-53.
Keiningham, Timothy L., Bruce Cooil, Tor Wallin Andreassen, and Lerzan Aksoy (2007), “A Longitudinal Examination of Net Promoter and Firm Revenue Growth,” The Journal of Marketing, 71 (July), 39-51.
Peeters, G. and Dzapinski, J. (1990), “Positive-Negative Asymmetry in Evaluations: The Distinction Between Affective and Informational Negativity Effects,” European Review of Social Psychology, W. Stroebe and M. Hewstone, eds. England: Wiley.
Taylor, S.E. (1991), “Asymmetrical Effects of Positive and Negative Events: The Mobilization-Minimization Hypothesis,” Psychological Bulletin, 110, 67-85.