
It goes without saying that a site’s performance is incredibly important. A slow site is simply unacceptable. In fact it might be the kiss of death for your site with 53% of users unwilling to wait more than three seconds for your mobile site to load before completely abandoning it. With an incredibly short timeframe to capture and retain your user, it’s important your site is highly performant. With so many factors contributing to a site’s performance, this can be a daunting task to take on. In this article, we will learn how to identify some of the common culprits and what can possibly be done to improve them.
Chrome’s DevTools can greatly assist in identifying what can be improved upon to boost your site’s performance. We will be overviewing the capabilities of two panels: Audits and Network. While there is an abundance of functionality available within these panels, we will only be previewing a small fraction of what is possible. We will be identifying common performance issues. It should be noted that all sites are different so you are likely to encounter unique situations when you audit your site. If you can gain familiarity with these tools, you will better understand what is happening and what you can do in order to improve your site.
Before we start, let’s open your DevTools. This can be done by right clicking in Chrome (other browsers offer similar tools but we will be focusing on Chrome for this article) and selecting the “Inspect” option in the dropdown. Preferably we would perform all our testing in a neutral environment like an Incognito window. This ensures no browser extensions will skew our results. Been there and done that so let me save you the unnecessary headache!

Audits
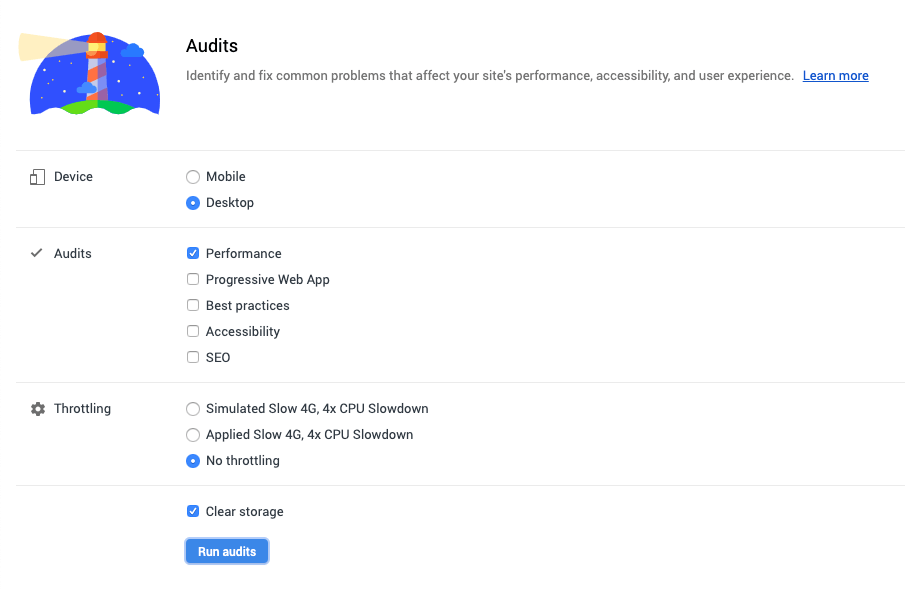
To begin, we will be jumping into the Audits panel as this will give us an idea of where our site stands. This will serve as a guide for when we jump into the Network panel. We will need to select our device type, audit type, and throttling we want to apply to our testing. For the purpose of this article, we will be using the defaults.
Once we run the audit, your site will be scored on the scale from 0 to 100. While the ultimate goal may be to get that perfect score of 100, it should be noted that this cannot always be achieved right away. Sometimes a major rehaul, like moving to a different server or refactoring code, is needed in order to increase your overall score. Often this is not feasible given the timeframe or the budget. Along with your score, you receive a detailed report of Metrics, Opportunities, Diagnostics, and Passed Audits. We will focus on the Opportunities and Diagnostic portion of the results as they give us valuable insight into exactly what we should be looking for when jumping into the Network panel.
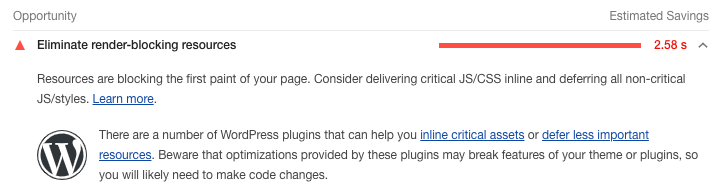
We will be focusing on those items in red as they are the most urgent. Let’s look at the example below. Our first item is “Eliminate render-blocking resources” which could approximately save us 2.58s. If you’re new the world of performance, it may not be obvious exactly what needs to be done here just from the label alone. If we expand the accordion, we gain additional information about what this means in addition to solutions like deferring all non-critical CSS/JS. Note that we are auditing a WordPress site so we are seeing suggestions tailored to that, but your site might offer different solutions depending on what it’s built on.
As we start implementing changes, we want to make sure we are running a new audit on the site to see whether our changes are effective. If we do not see our score increase or worse decrease, we can decide to revert that change. This strategy allows us to identify what works best and how much our site is benefiting from it.
Network
Now that we know which items need to be addressed from our audit, let’s open the Network panel. Before we dive into specifics, here is a simple overview of the network panel. If you are not seeing any data within this panel, give your page a hard refresh as it will only show data if DevTools was previously opened. Here are the three main parts.
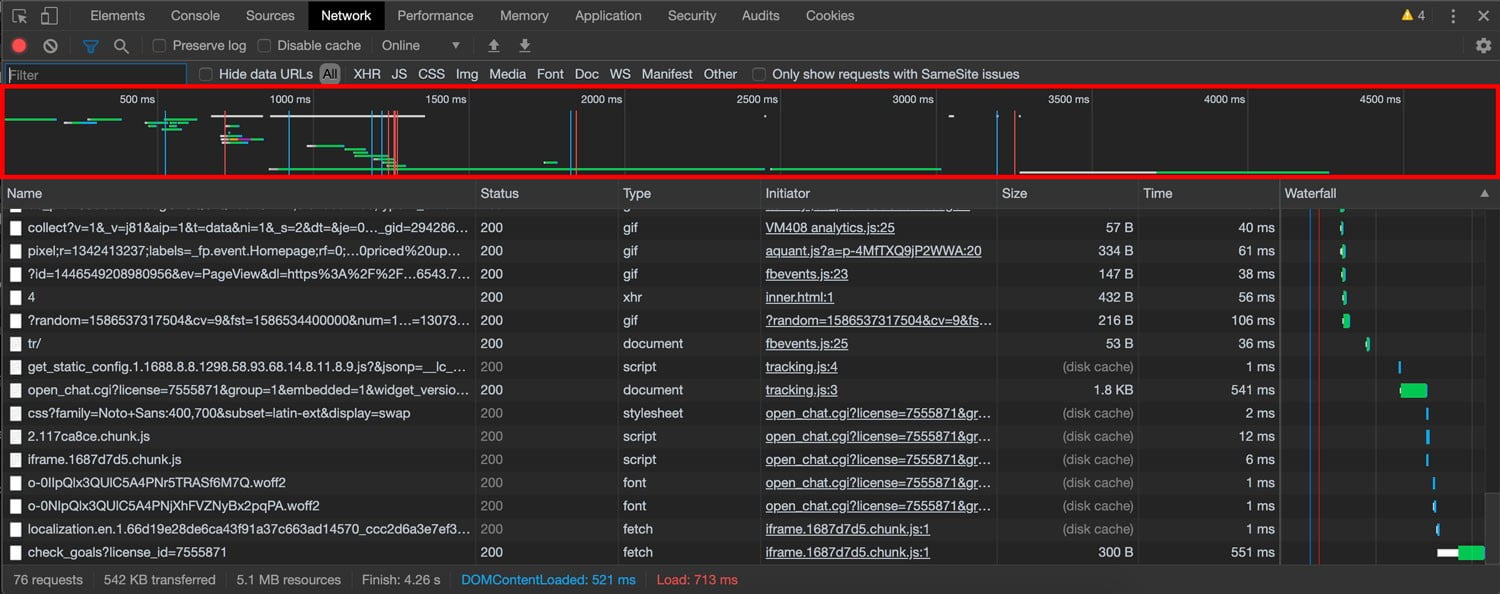
Waterfall
This is a visual representation of how your site loads in its resources. You can view specific timeframes by clicking into this area and it will filter the resources below that were being loaded during that time. This is useful for identifying which resources are taking a longer time to load. For instance, the page request, the first request, stands out to me right away. It is taking 1.23s to load with TTFB (time to per first byte) accounting for 1.13s of that time. I would want to look at my server to answer that.
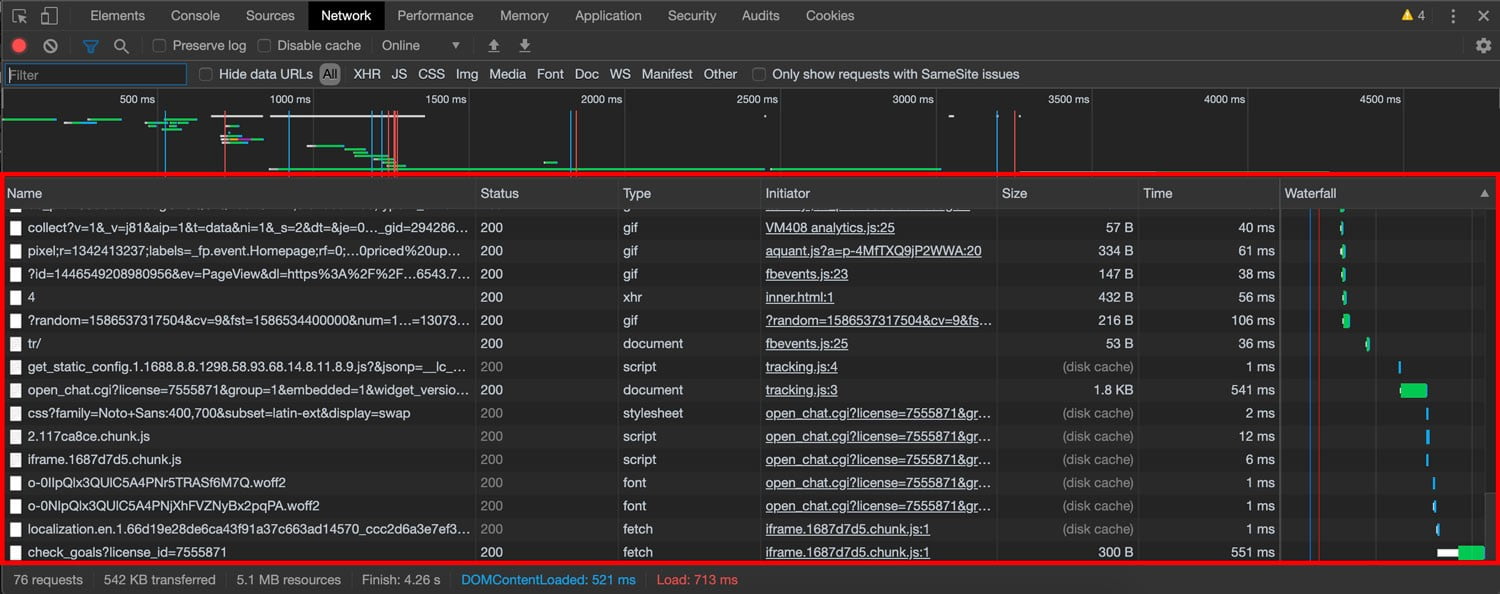
Status Log
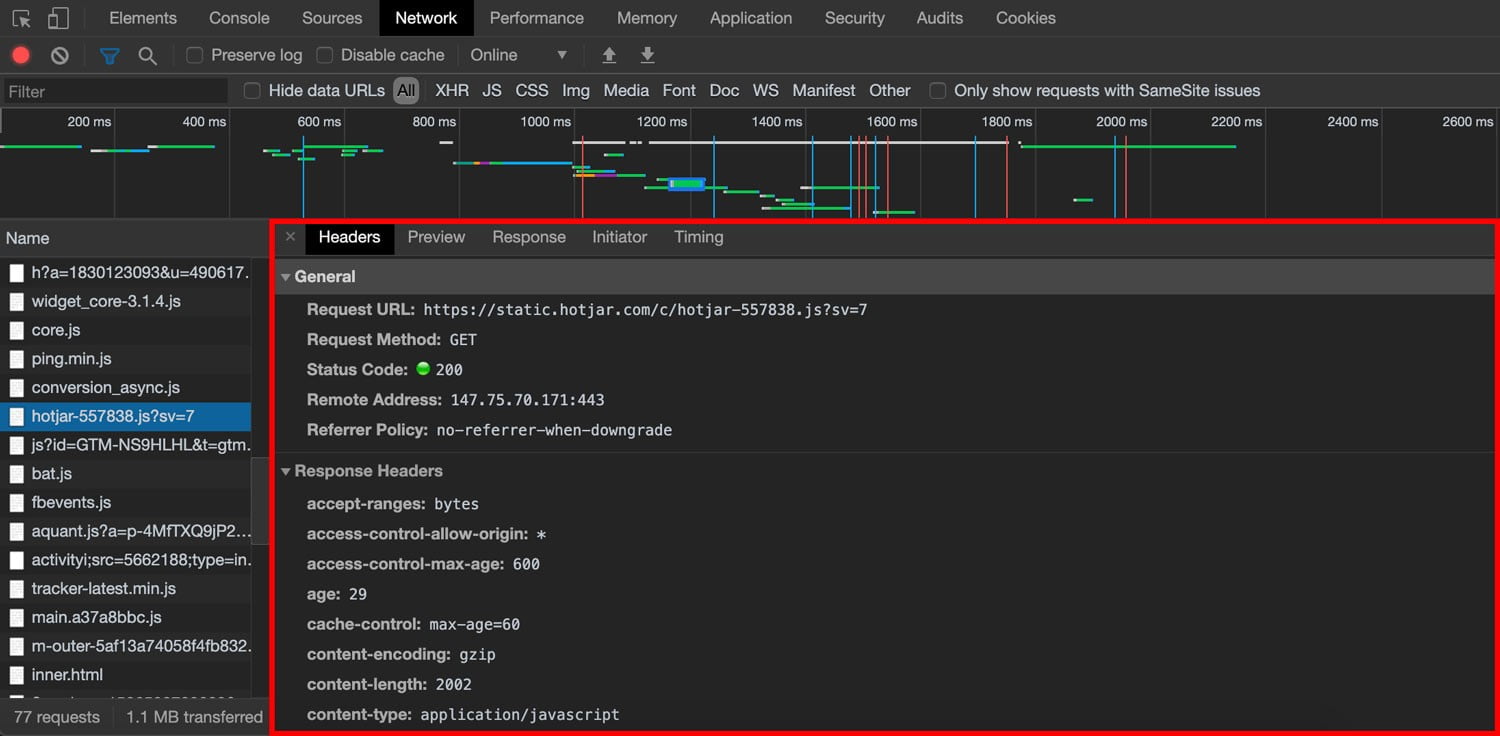
This is the chronological log of network activity for that particular page. Name, status, type, size, time, and waterfall columns display by default but there are additional columns that can be added like method, domain, and protocol. You can customize this area to display the information that is most important to you.
You can also click into each individual resource to gather more information about it like headers, preview, response, timing, and cookies. When it comes to performance, I use the Preview tab to double check my minified files. You can quickly see the difference between a minified file and a file labelled as minified.
Summary
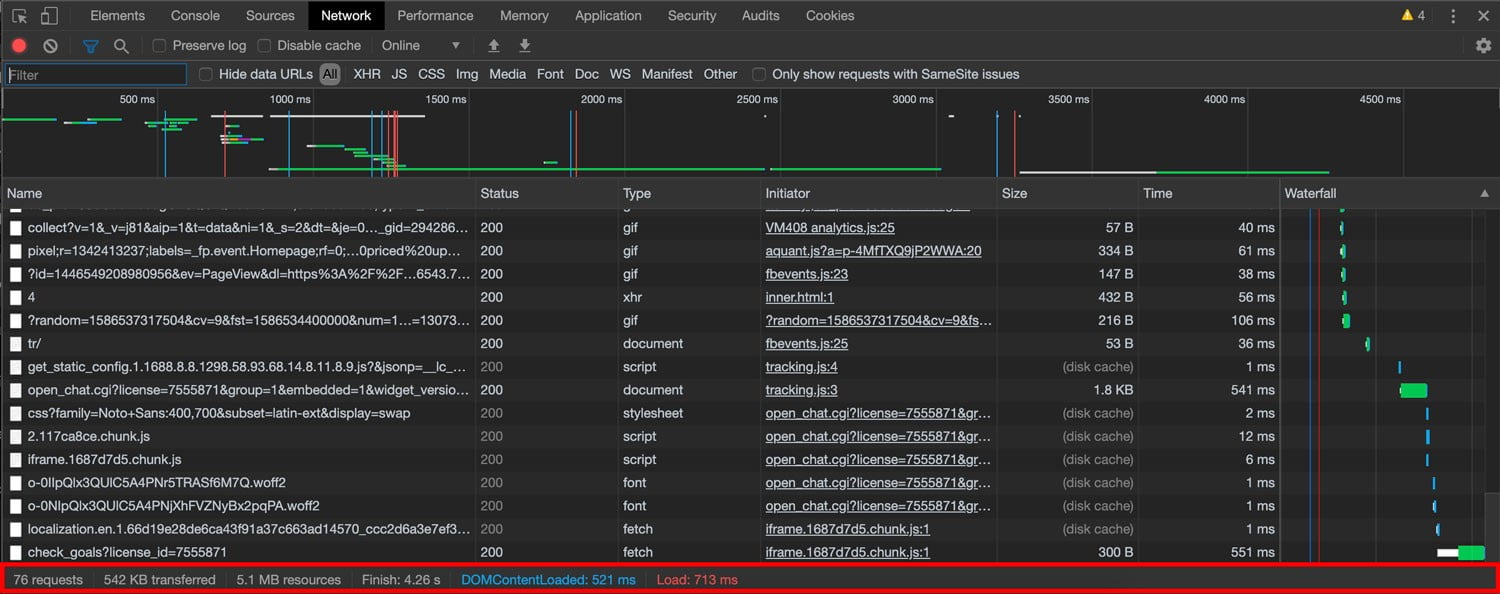
Use this to see how your page is performing especially those last two metrics: DOMContentLoaded and Load. Note the colors of these two metrics. Unlike the Audit panel where red signified areas of improvement, this color just correlates to the waterfall above. You can see there are two lines of the same colors.
Network Tip & Tricks
Now that you are familiar with the layout of the Network panel, let’s jump into tips and tricks to quickly boost your performance.
Image Compression
Whenever I jump into this panel, I immediately check for images. Making sure your images are compressed is an easy performance boost. Instead of scrolling through the status log to see all images, we can filter to all images by clicking the filter icon. Once expanded, we can see there are predefined options like XHR, JS, CSS, Img, Media, Font, Doc, WS, Manifest, and Other. With these predefined options we can filter by all images or we can use regex in the text field to preview a select file type like SVG, WebP, or PNG.

Once we have all our images, we can check whether these images are properly compressed. You can sort the images by the column size so you can quickly identify the largest images on your site. I would not recommend any image be more than 1MB on your site and even this is generous as multiple images of this size on mobile would be problematic.
When it comes to images, another easy performance win is to ensure compression is enabled on your site. The two values in the size column should not be the same value. The top value represents the downloaded resource size while the bottom value represents the uncompressed file size. If these are the same, compression is not enabled on your site. You can either implement this within your task runner or leverage a plugin on a WordPress site.

Coverage
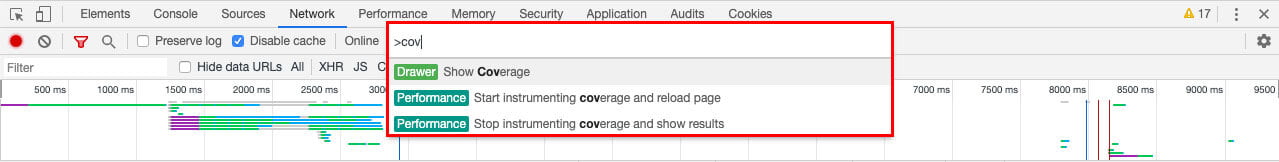
Now using what we learned from our audit, we can see how much of our CSS and JS is not being used on this page by opening the Coverage drawer. You can access this by typing “coverage” into the Command Menu. I recommend exploring the Command Menu as it offers numerous options beyond the Coverage drawer.
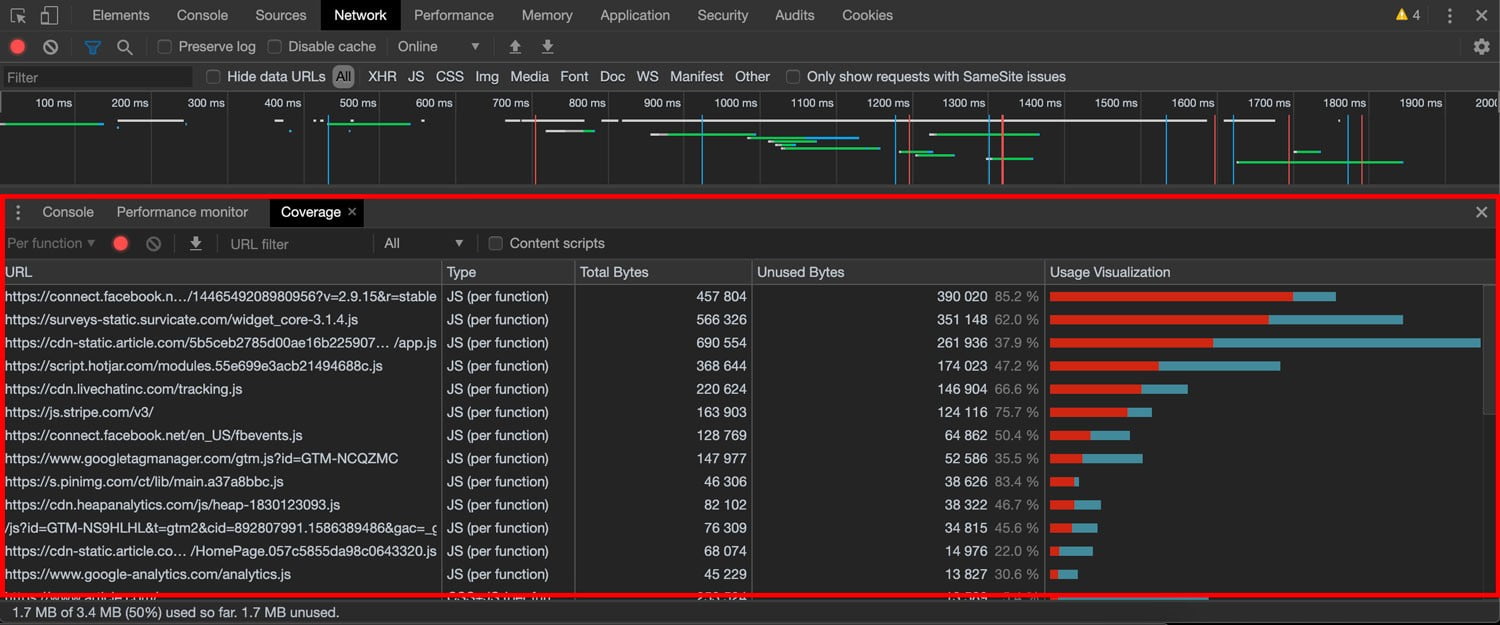
With the Coverage drawer, we can see the total bytes versus the unused bytes for the page along with a visual representation of these two metrics. For instance, we can see in the screenshot below that only 14.8% of global stylesheet for the site is being used for this page. If we could deliver only the relevant CSS for this page, we would likely see a boost in performance as the page would not need to wait to download the entire global stylesheet. As suggested by the “Eliminate render-blocking resources” opportunity in our audit, this could be accomplished by utilizing the Critical CSS method. Of course, this is not a viable option for everyone so make sure all decisions in regards to performance are properly weighed.
Request Blocking
From the Command Menu, you can also access the Request Blocking drawer. One of the biggest benefits of using the Render Blocking drawer is that you can experiment without ever touching your project’s files. You can create rules to block certain assets to see how they negatively or positively affect the page. For example, we can see how our site performs if we block the script that powers the chat widget on our site. Luckily for us this is being loaded asynchronously but if it wasn’t and we saw a dramatic increase in the page’s performance, we might be able to make a case to switch to a better performing chat widget or even contact the company to see what can possibly be done to improve its performance.
You can also use this feature to identify unnecessary scripts on your site. For example, we are often placing media tags on our site. Sometimes when the campaign has run its course, we do not do the necessary maintenance to remove those, so our site becomes littered with these unused scripts.
Network Throttling
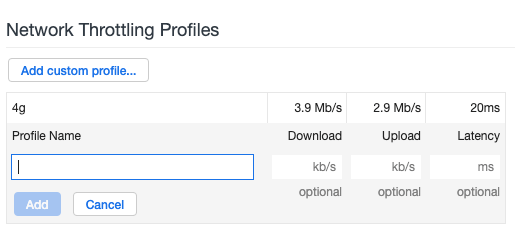
It’s important for us to remember that when developing a site, our user’s might not be experiencing the site in the same way that we are. Often, we are developing on a high-speed connection which gives us the false reality that our site is loading extremely fast. To simulate other connects like mobile, we can throttle our network. There are predefined options like Online, Fast 3G, Slow 3G, and Offline. It is important to keep in mind that your site will inevitably be slower on these networks, so they have their own relative levels of success when it comes to performance.

You can even add custom throttling depending on what your audience is most likely to use.
Summary
There is so much that can be done within these panels to uncover issues that may be affecting your performance. We have barely touched the surface of all that can be accomplished within Chrome’s DevTools. I urge you to continue to explore as you will likely find something that can be instrumental in bettering your site’s performance.