
While it may seem obvious to some, it’s first important to take a minute to understand what exactly is meant when we say “open rate.” It may surprise some to learn that when an email service records that an email campaign was opened by one of the recipients, all it really means is that the 1×1 invisible pixel image that the email service automatically places in all email campaigns has been loaded. That’s how an email service “knows” that an email has been viewed/opened—i.e. when their server records that someone has accessed that 1×1 pixel image.
Many people however either set their email clients to download images automatically or are using an email client that is set by default to download images automatically, which results in the skewing of open rate stats. For example, when gmail switched to auto-downloading of images at the end of 2013, open rates for all of gmail went up by 3%, according to a 2013 Litmus study.
According to a /Silverpop study released in early 2013, the average unique open rate of email campaigns in the U.S. was 18.9% in 2012, with the bottom quartile averaging 8.2% and the top quartile averaging 35.7%. The gross open rate was 35.7%, with the bottom quartile averaging 11.8% and the top quartile averaging 79.8%. The difference between gross and unique open rates is explained by the “opens per opener” metric that measures the average number of times an email is opened by the same person. In the aforementioned study, the gross open rate in 2012 averaged 1.89, with the bottom quartile averaging 1.44 and the top quartile averaging 2.30.
It’s important to note however that email open rates vary widely by industry. A /Silverpop study released in early 2013 showed an average unique open rate range by industry ranging from 13.4% for computer hardware, telecom and electronics companies, to 23.8% for consumer products companies.
It is also important to note that triggered emails tend to experience dramatically higher open rates than non-triggered emails. /A Q4 2012 Epsilon study of 7.3 billion emails sent across a variety of industries highlights a triggered email open rate of 46.7% but an overall email open rate of only 27.4%.
A triggered email is simply an email that is sent out through the use of a trigger. The trigger being something such as clicking an email sign-up button on a website, a certain date taking place (e.g. birthday or anniversary), or the next email in a multi-email drip campaign being automatically sent.
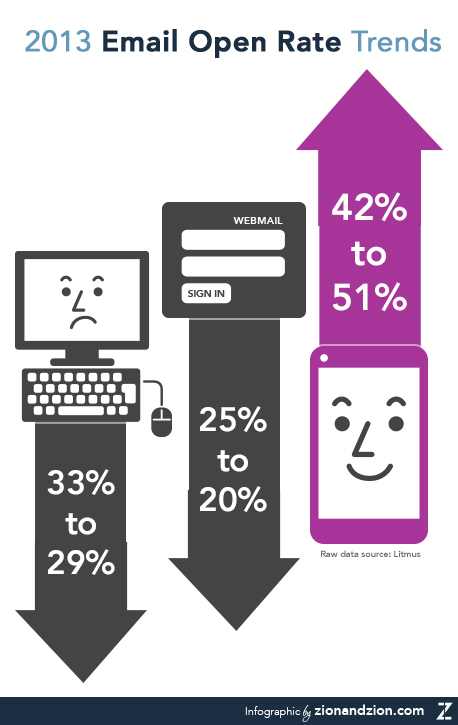
In general, people are opening email much less with desktop clients and webmail than they are on mobile devices. Over the course of 2013, from January to December, the percent of emails opened on desktops dropped from 33% to 29%; the percent of emails opened in webmail dropped from 25% to 20%; and the percent of emails opened on mobile devices rose from 42% to 51% according to Litmus data released in early 2014.
The message here is that there are a variety of factors that can affect email open rates. We’ve discussed some of those such as industry and triggered vs. non-triggered, however, bear in mind that not only is every industry different, but that every company has a different relationship with its customers/subscribers. Other key factors influencing open rate include the day or week and time of day that campaigns are sent, the frequency with which campaigns are sent, the sender displayed on the email, the subject line, and the interaction that subscribers have had with previous email campaigns from the same company.
The best way to proceed is to keep one eye on industry stats and trends and the other eye on the relative increases and decreases in performance that you are able to achieve for your own campaigns over time.