
Infographic mania
“Infographic” has become quite the buzzword in both social media and content marketing, but have you ever tried to define exactly what you think an infographic is? Once it became a best practice to use infographics in social media for our clients at Zion & Zion, it was obvious to me that everyone had their own perception of infographics; each one a different combination of visuals and utilization of words, numbers, and artwork. In this discussion, I think that in order to best understand where we are, we must first understand where we have come from. So to start, let’s take a step back…
The evolution of visuals and social media
Pictures tell a thousand words; this much has been true throughout history. Infographics have /been around for hundreds of years, long before recently gaining momentum in the social media world. From great classic painters like /Vincent Van Gogh, to the most amateur graphic designers of today, such as the 22-year old who recently /used Photoshop to purposefully fake a vacation through Asia for her family, the visual medium continues to have the power to incite a wide range of emotions, reactions and interactions within society. What’s more is the world’s increased dependence on technology, particularly with regards to how social media has become part of our everyday lives, has made this truer than ever before.
Now that more humans have access to the internet, own a smart phone and have accounts on social media platforms than ever before, it seems obvious to me now, looking back, that it would only be a matter of time before visuals began dominating on social media.
Having been online for 17 years, and on what we would consider traditional social media outlets today for about 10 years, it’s interesting to look back and remember that when social media first “began,” the written (or typed) word was king. From AOL chat rooms, to Yahoo Instant Messenger and even MySpace or Facebook’s initial rollouts that existed primarily either to connect with everyone from your past and present via message, or reflect what you were up to (remember “Charles Clarkson is… [insert activity]”?), the written word took precedence over visual.
In a nutshell: “/video has killed the radio star” once more (a metaphor referencing /MTV history, for all of you younger millennials out there). Simply look to the most popular social media platforms out there today, all of which happen to be photo-centric; /Instagram, Pinterest, Flickr, Tumblr and /YouTube are visually-based, niche social outlets. Not surprisingly, in the last year or so, both major “word-based” social media outlets, Twitter and Facebook, adapted to support images and videos, transforming them and helping them to maintain their dominance (and relevance) in the social marketplace.
Images, videos and social media marketing
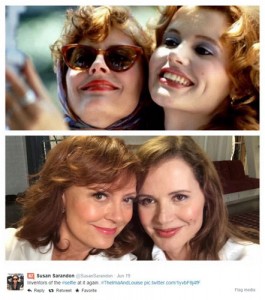

From a social media marketing perspective, the visual (whether it is an image or video) now outperforms the simple written word on social media, and has been doing so for the last year or so. Analysts saw this /trend begin as far back as 2011. And how could it not, as images have taken on a grassroots life of their own in the social media sphere. These days, there are classic photographs and designs, as well as new online image phenomenon such as memes and infographics. Let’s not forget the ever popular “selfie;” a self-taken photograph whose name became viral on social media, successfully spilled over into mainstream media and marketing, but which originally was simply just referred to as either a very difficult photo to take or a “Thelma & Louise” shot, as those of you older millennials who remember /this classic 1980s film will recall (I sure did).
However in this transformation from words to visuals, authors/bloggers/copywriters and photographers/graphic designers/artists luckily don’t have to choose between one or the other when it comes to social media. Words have the potential to enhance the visual, and vice versa. And so the rise in popularity of infographics has taken off.
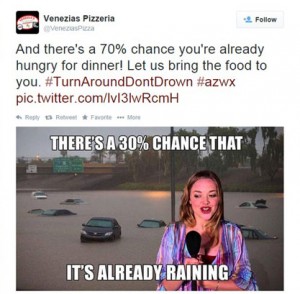
Alongside the rise in user-generated images and videos, the social media evolution recently has seen a consumer-driven demand for similar changes in the types of content that businesses put out. In the last two years it has become vital for businesses to humanize, in that they need to both provide real-time customer service and put out valuable content that tells a story. It’s important to note though, that “the story” can be anything from creatively conveying who you think your target market is, to sharing expert tips that originate from outside sources that are only industry-related to your business. Data shows that consumers don’t want social media to be another platform for traditional advertisements. Additionally, data also continues to increasingly show that consumers are primarily /responding to posts that contain images and videos. And businesses are /responding. Ironically (or not), the company that best understands all of this is Facebook, as you can see with the company’s recent ads for /Mother’s Day and its /mobile app upgrade.
What makes a visual an infographic?

So here we are today, when as you can see, it is vital that businesses communicate via social media with very strategic goals and tactics in mind. One of the many social media tactics businesses will utilize is the visual, one of which includes the almighty infographic. So again, I ask: what is an infographic?
The debate over this definition yielded differing responses among colleagues and online search:
– “It’s an image.”
– “Any designed image for use on social or online media.”
– “A designed image that primarily uses words and numbers.”
– “Any image that tells a story.”
– “A pretentious graph.” – /UrbanDictionary.com
In my professional experience, I initially perceived infographics to be images designed using numbers or information (primarily numbers) to tell a brief story in a compelling manner, however this could have been easily shaped by the clients I have worked on. In my time at Zion & Zion, I have worked with clients in many industries and verticals, but when you’re charged with doing social media for clients in traditionally “less sexy” industries like home improvement or transportation, you have to get pretty creative to make the message compelling and interesting. In debating this with my colleagues, I recalled something I learned at a conference.
In 2013 I attended a social media conference in Las Vegas, Nevada called New Media Expo (NMX), where I was fortunate enough to attend a session on the subject of infographics. One of the speakers who stuck out in my mind works for a company from South Dakota called /Lemonly, which deals solely with infographics. Needing clarification on the subject at hand, I tweeted them for a bit of their expertise.
The consensus from this conversation and debate among social media marketers, upon which I fully support, is that a social media infographic is “anything that uses visuals to help explain a dataset,” or similarly, “any visual that is created using a dataset to tell a story.” These datasets can be either qualitative or quantitative; however, it is absolutely necessary that the infographic makes the dataset easy/easier to understand, by way of the visuals. As infographics have evolved, there is currently no standard for the length or size of a social media infographic; this should only be dictated by the platform the image is being displayed on. As with any image created for social media, design the infographic to fit the platform!
What do you think? Tweet me at @CCPolitico, I’d love to hear what you have to say!