
Think back to when you were a kid, and you would stand with your back to the wall to measure how much you’ve grown. Every few months you’d put a mark for how tall you were, and then over time you were able to compare the marks to see how much you grew. What you’ve done here is a form of benchmarking. While a micro example of benchmarking, we apply the same basic techniques to everything we do here at Zion & Zion.
Benchmarking is a process used to measure how much something has improved by comparing it to a previous version, industry standards, or a competitor.
UX is the experience a user has interacting with something (whether that something be a website, mobile app, ATM, or any other type of product). For example, think about trying to deposit a check on your phone through your bank’s mobile app. Were you able to easily deposit the check? Was there anything that made your experience less than enjoyable? At Zion & Zion, our UX team focuses mainly on the UX of websites and applications. We ask users questions, like the above, to figure out how we can make all interactions as seamless, intuitive, and as easy to use as possible. Benchmarking allows us to compare, test, reassess, and continuously improve upon our work. Today we’re going to focus on why benchmarking is important, and how to benchmark with analytical data and user testing.
Why You Should Benchmark
Whatever service or product your company offers, benchmarking specific aspects of your business, like number of subscriptions or sales volume, will give you the data you need to determine where you need to improve and by how much. You’ve heard the saying, “set the bar high,” but what benefit does that have if you don’t know where the bar was before? Or, if you don’t know if what you did previously actually worked? Often times, companies fail or under deliver because they set the bar unrealistically high during the improvement process.
You can and should benchmark your business in multiple ways. For example, at Zion & Zion, we set benchmarks based on quantitative and qualitative research for our websites and web applications. By performing research, understanding what KPIs are important to the business, and understanding what areas are most troubled, we can create a benchmarking plan to not only give context, but to provide an analysis on how much we’ve improved. This all ties into UX in terms of how we’ve improved the experience for users based on data collected from previous versions of the product.
While there are countless forms of quantitative and qualitative research, I chose two of our top picks to focus on within this article. By including both analytical research and user testing, you’ll have a more expansive data set to work with.
Analytical Benchmarking
Analyzing data from benchmarking can be subjective, since there are many unforeseen variables that can be the underlying reason for changes you see. For instance, you may see that your website traffic increased this weekend. By only looking at analytics, you may not be able to fully understand why. However, by performing additional research and digging deeper, you may uncover something truly insightful. For instance, what if you find out that the cause of your traffic spike was from a new advertisement the digital marketing department was running, or maybe it was due to a major event that affected a certain region of the country. When benchmarking websites, there are key analytical data points we look at, including, but not limited to:
- Page views
- Time on page
- Bounce rate
- Average number of page views per session
- New vs. returning visitors
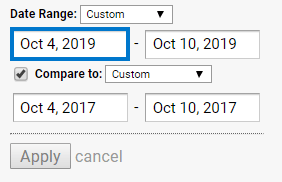
You should add an annotation within Google Analytics noting when you launch a new website or make a major change. This way, after launch and as you begin to collect data, you’ll be able to perform date-range comparisons to analyze how your updates are performing compared to the previous version.
When picking date ranges to compare, be sure you’re comparing apples to apples. In other words, you want your days to follow the same day of week and same time period of the month (e.g. October 4-10, 2017 compared to October 4-10, 2019).
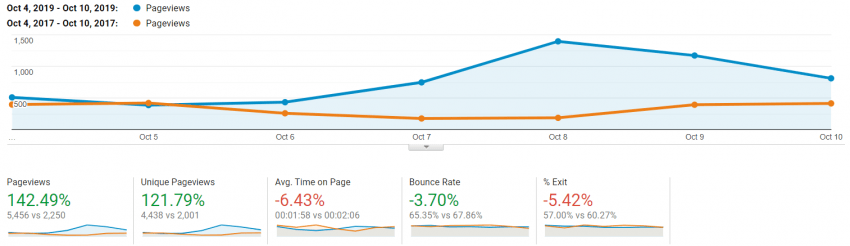
If you look at the figure below, you’ll see what this looks like in Google Analytics. Based on this kind of data, you can determine if your website has improved or declined based on the benchmarks set. When analyzing the data based on benchmarks you’ve set, you’ll want to be aware of the multi-variant factor. For instance, in a new version of a website, you could focus heavily on improving one aspect of the site, only to find out later that in doing so, you hurt another area of the site. At minimum, by knowing where you were previously, you can have context on how well the current data is doing.
User Testing Benchmarks
While analytical benchmarking provides you with quantitative data, user testing benchmarking gives you qualitative data. With user testing, you’re able to witness firsthand how your users are interacting with your website and can gain valuable UX insights. For this reason, the value gained from testing on actual users is second to none. User testing can take on many different forms including, but not limited to:
- Usability tests
- Preference and click tests
- Five second tests
- Recorded user tests
- Observed user tests
- Heat maps
- Scroll reach maps
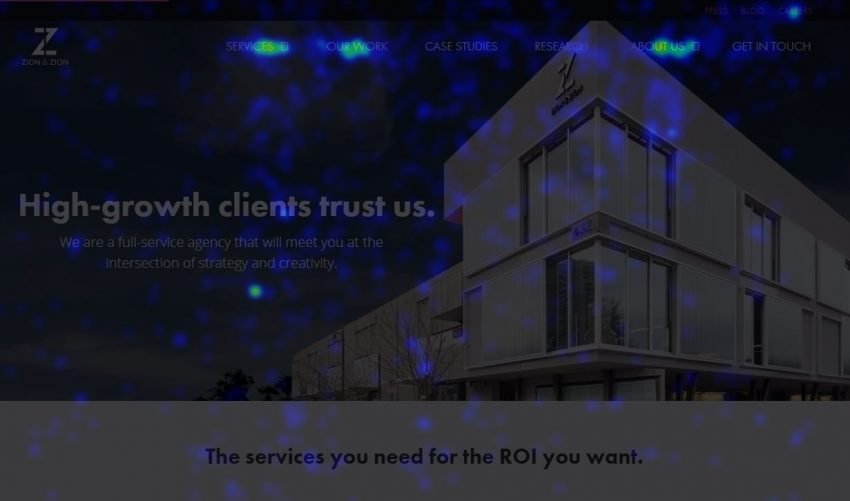
Above is an example of a heatmap. You can see where users are moving their mouse, what they’re interacting with, and on the other hand, what they’re ignoring. When analyzing recorded user testing, you can observe everything the user does, from how they interact with certain elements, to areas of the site that cause confusion or frustration.
In general, user testing requires carefully planned and defined benchmarking procedures because you’re dealing with real users and qualitative data. When you set up these types of benchmarks from user tests, it’s crucial you ask the same questions, have users perform the same tasks, and use the same demographics. Otherwise you’ll be comparing apples to oranges, which is less than ideal.
Conclusion
In conclusion, benchmarking is a process that should be incorporated into everything you do. User experience, web design, and development are no exceptions. No matter what changes you’re looking to measure, quantify, or report, benchmarking can help you find the data you’re looking for. Simply put, it’s a process that has no boundaries.