Predicting Home Buyer Activity

Summary

Our media buying and analytics team was able to demonstrate a strong and statistically significant connection between our Zillow and Trulia display banner advertising and visits to the DMB Eastmark visitor center building. The strongest connection was demonstrated in our third regression model (out of four) where the outcome variable was visits to the DMB Eastmark visitor center two weeks after Zillow and Trulia display banner advertising impressions.

Our Role

  • Digital Media
  • Traditional Media
  • Paid Search
  • Lead Generation

The Challenge

At 3,200 acres and five square miles, DMB Associate’s Eastmark development is the largest real estate development project of its kind in the US in a decade. DMB Eastmark includes a 100-acre Great Park, housing developments, resort components, employment cores, and recreational spaces. Zion & Zion has served as the agency of record for DMB Eastmark for the past several years.

A key challenge in many media campaigns is understanding the relative roles of various forms of media in achieving a client’s objectives. Some industries in particular are less inclined to shift significant portions of their budgets to digital media, and home building and real estate development has been one such industry, so demonstrating the effectiveness and role of digital media is a top concern.

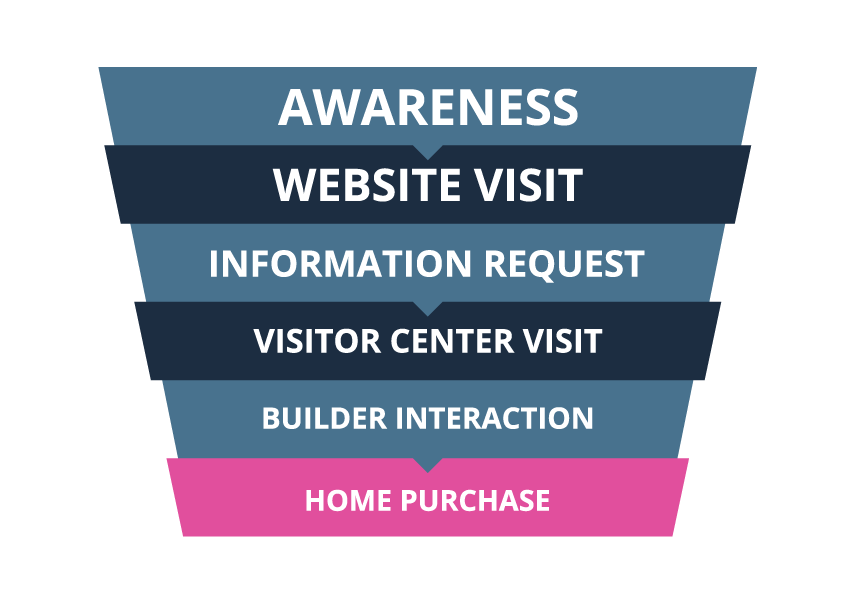
In particular, a funnel exists that ranges from awareness at the top to purchase of a home at the bottom. In the case of DMB Eastmark, visits to the physical (i.e. on-property) visitor center are close to the bottom of the funnel.

DMB Eastmark Conversion Funnel

The Research Question

In order to understand the impact of digital media, we developed the following research question:

What is the impact of digital media on lower funnel activity, and how can we develop a model of this to drive understanding and future results?

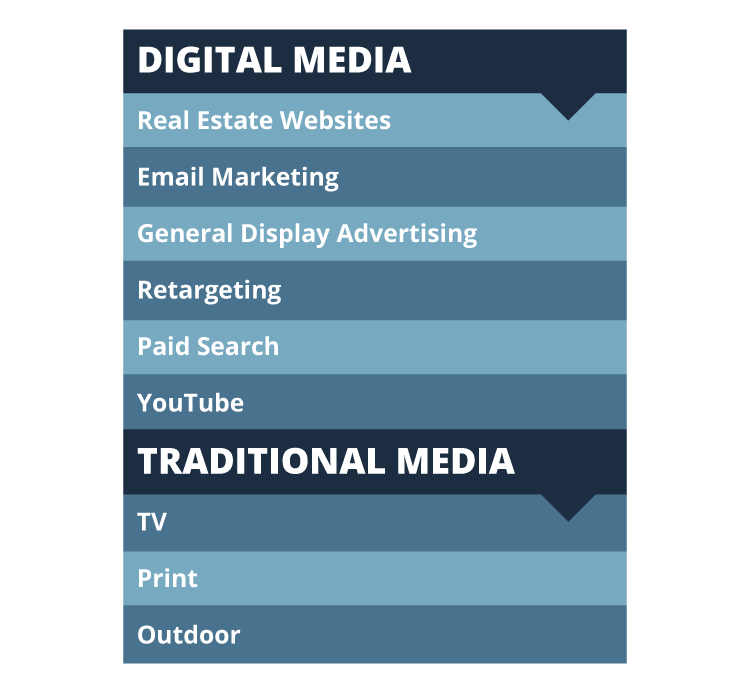
Digital and Traditional Media Formats


The Analysis

Using statistical processing software, we were able to analyze DMB Eastmark’s data from the campaigns we had run for 31 media impression categories, encompassing both traditional and digital media. Our Strategy and Analytics team ran several multiple linear regressions in the FORWARD method where only the significant variables of 95% significance or greater were selected for the model.

We began the model with the media category which explained the most variance in Physical Visitor Center Visits (PVCV). We then repeatedly examined the list of remaining variables and continued to add additional variables to the model in descending order of each variable’s ability to explain additional variance.

We ran this analysis on four variations of our dependent variable—PVCV where each variation was a different time-lag between media impressions and PVCV. The variations were:

Variation 1: PVCV that occurred during the week following each week’s media impressions.

Variation 2: PVCV that occurred two weeks after each week’s media impressions.

Variation 3: PVCV that occurred three weeks after each week’s media impressions.

Variation 4: PVCV that occurred four weeks after each week’s media impressions.

The intent was not only to understand which variables impact PVCV but also what the delay in the impact was. Hence the four variations.

NOTE: We also examined other KPIs and found correlations between both traditional and digital media on various KPIs, but the focus of this particular case study was to look at the impact of digital media on lower funnel activity.

The Results

Our best model was able to achieve an R squared of .418 in PVCV—i.e. our best model explained 41.8% of the variance in PVCV. Specifically, that model was the one with the two week lag PVCV, (i.e. Variation 2). The explained variances for all four models are shown here.

Variation 1 (one week lag): 23.6% variance explained

Variation 2 (two week lag): 41.8% variance explained

Variation 3 (three week lag): 12.4% variance explained

Variation 4 (four week lag): 17.3% variance explained

The significant independent variables in Variation 2 (i.e. the model whose dependent variable was PVCV two weeks after media impressions) were Zillow and Trulia. Both Zillow and Trulia are real estate websites that list dwellings for sale. We found that for every 1,000 impressions on Zillow and Trulia combined, we predict three visitors to the physical DMB Eastmark visitor center. The p-values for both the Trulia and Zillow variables were p<.001. It could be argued that our actions in investing in advertising on Trulia and Zillow were collinear with seasonality, and that PVCV was collinear with seasonality, however, we also made other media investments that did not show a statistically significant relationship with physical visitor center visits. Remember, we examined 31 distinct media impression categories.

The bottom line is that digital media activities had a statistically significant impact on the low funnel metric of physical visitor center visits. And as noted earlier, traditional media did have a correlation with other KPIs, but examining that is beyond the scope of this particular case study.

While the relative impact of various media activities on various funnel metrics varies widely per client, this case study highlights our ability to analyze such data and turn it into useful drivers of media strategy for not only DMB Eastmark, but for other Zion & Zion clients as well.

Top