
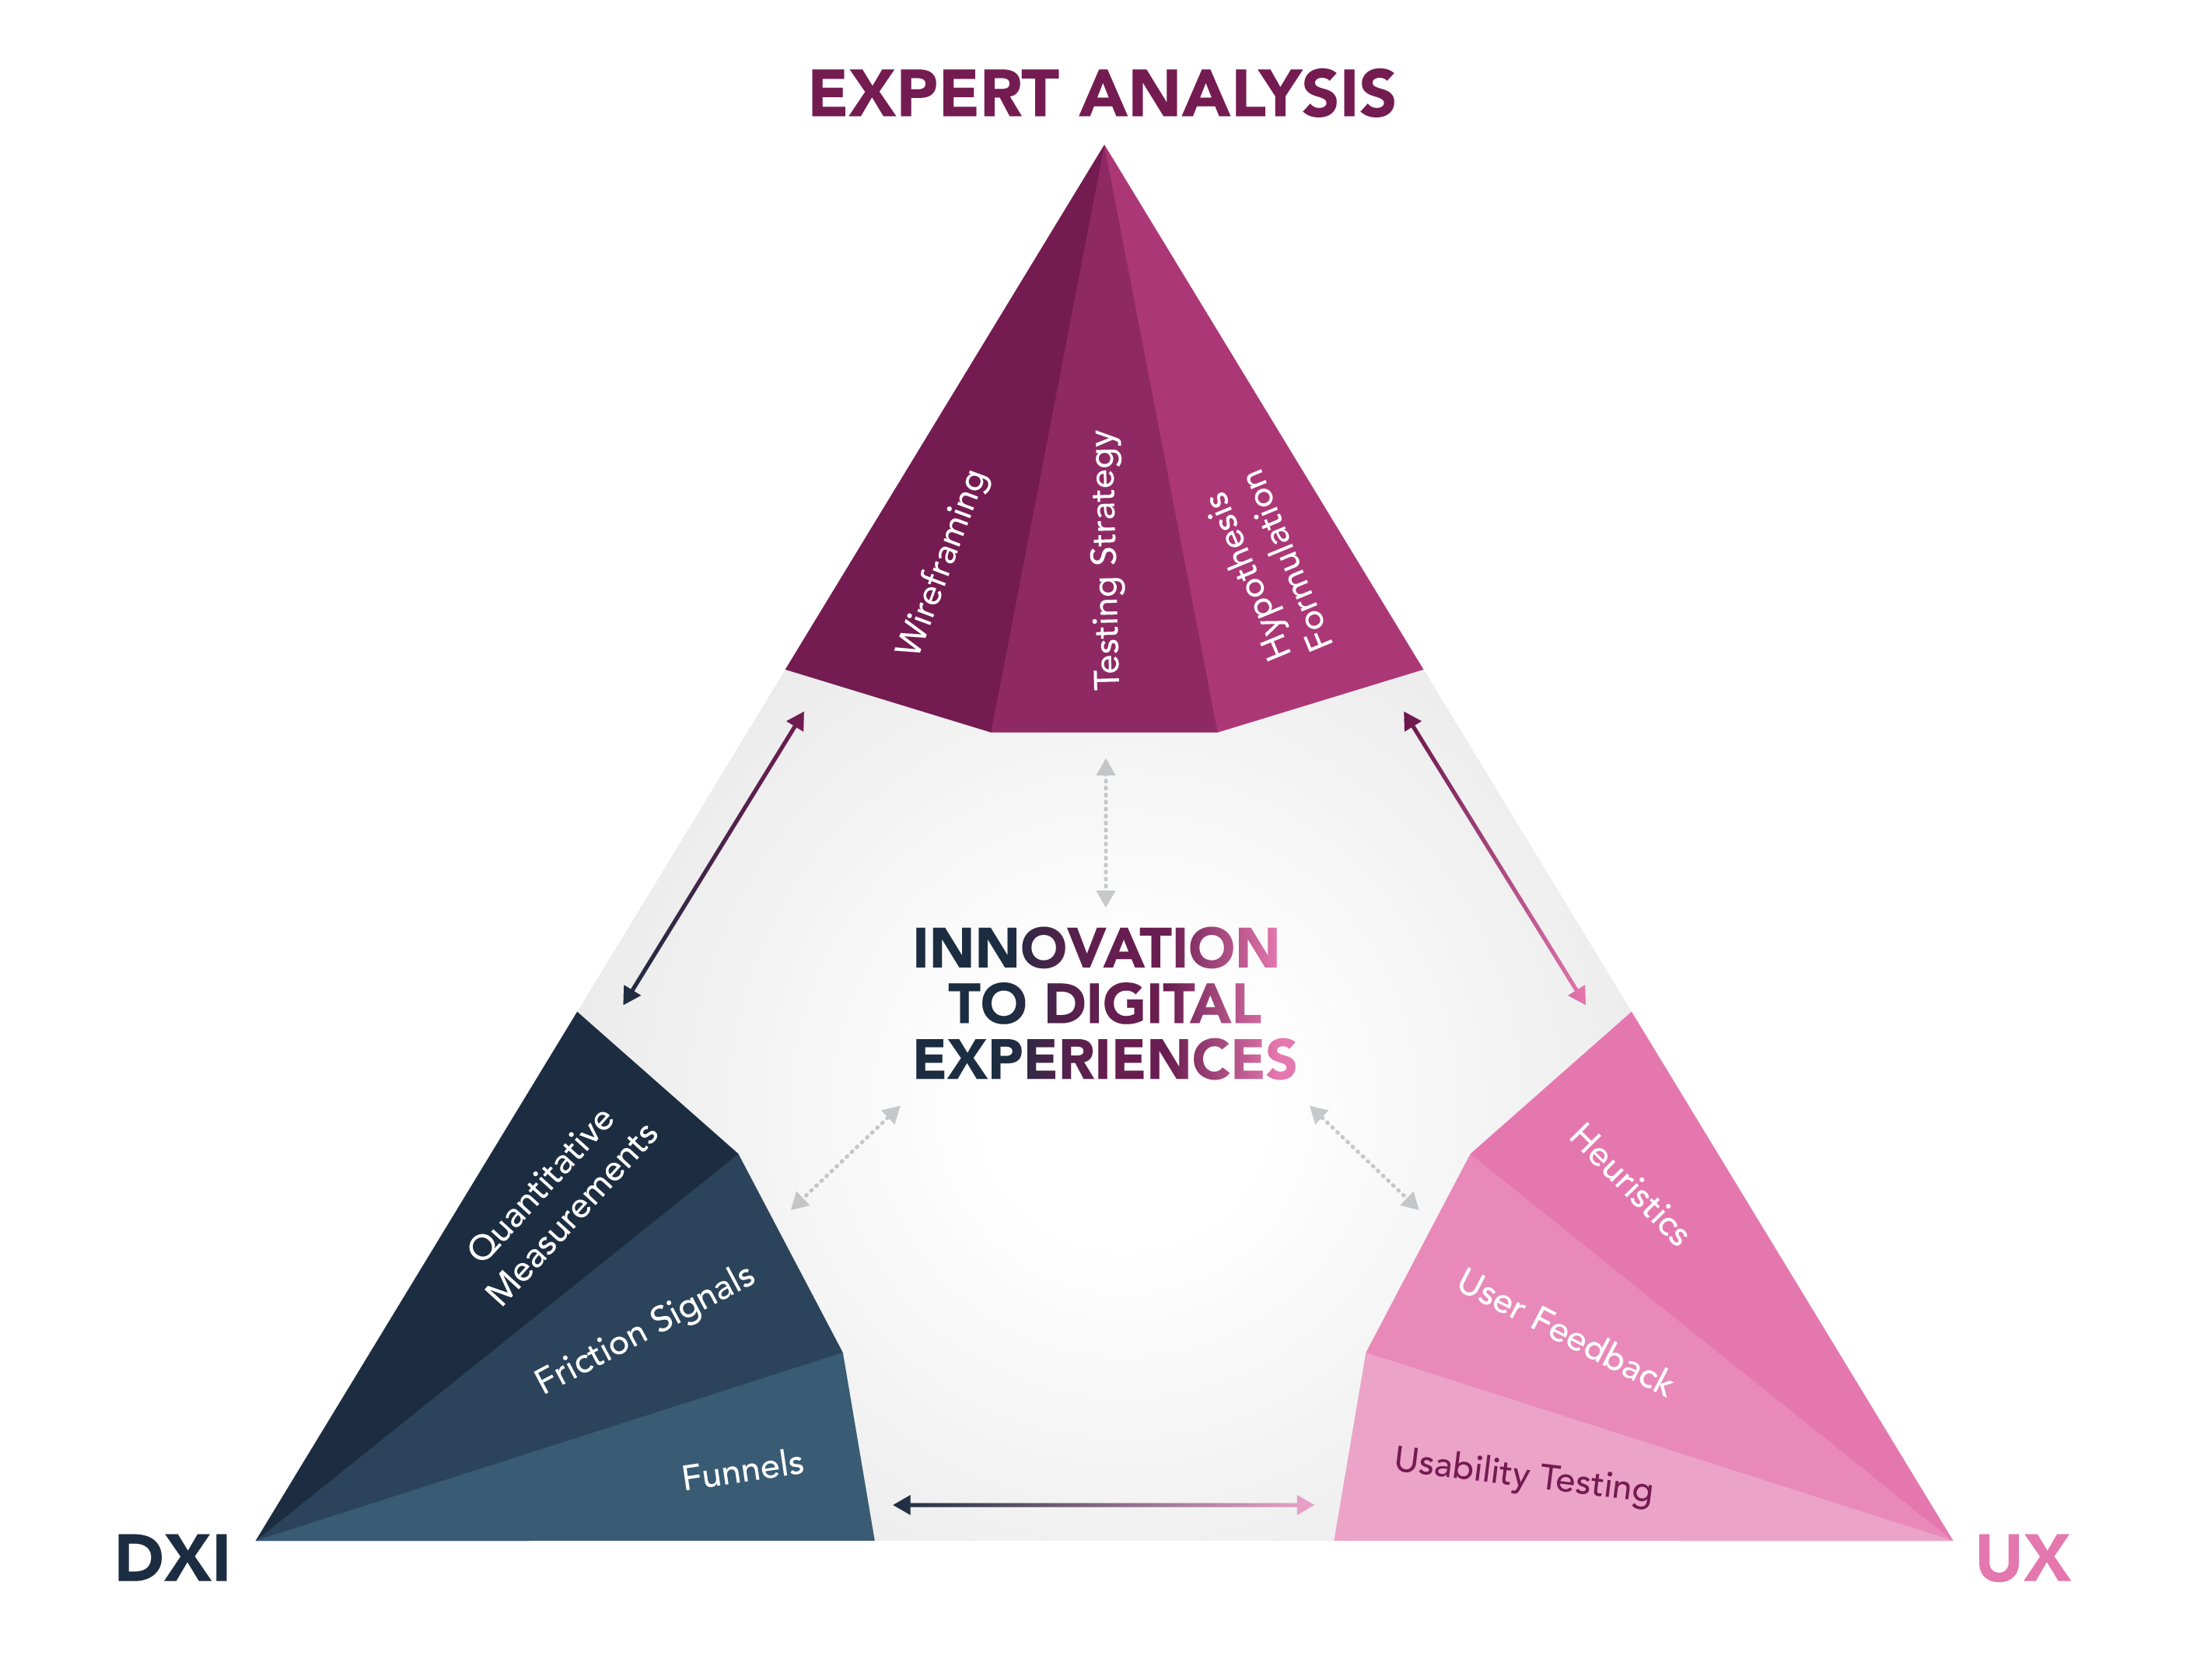
Digital Experience Intelligence (DXI) tools are an efficient and consistent way to understand what is happening while your users engage with your website. However, understanding user engagement does not directly correlate with formulating innovations that improve the overall digital experience. By analyzing DXI data and merging it with UX insights, in conjunction with expert analysis, we can validate and strengthen our approach to innovating digital experiences.
Let’s walk through the actionable steps you can take to merge UX and DXI in order to enhance innovating the digital experience.
Formulate business questions to guide research
One of the biggest struggles of using a DXI platform, such as FullStory, is getting lost in a sea of data. Without a defined plan of action for the research you collect, you will find yourself blindly navigating your DXI platform, capturing a plethora of data and information, but lacking a strategic path to put that data to work.
To combat this pitfall, it’s important to start with asking, “what questions do you want to solve?” This will lead your research in the direction of finding an answer.
The questions may be broad business-related questions such as:
- How can we streamline our conversion funnel and prevent blockers for users?
- Where do most users drop off from our website?
- Why have we seen an increase in product returns?
Or they may be more specific use cases such as:
- What is preventing users from moving forward from our product detail pages (PDPs) to our checkout funnel?
- How can we increase our conversion rate from 2% to 3% by the end of the year?
- Do users know how to find and use the new assessment feature we added to the website and is this helping lead to conversions?
Establish KPIs to measure success
Now that you have established your business questions, the next step is to establish key performance indicators (KPIs) that will assign measurements to success. Some of the questions may lead to more intuitively obvious solutions, such as overall conversion rate improvement, but some may require more steps to reach a conclusive measurement, such as defining funnel steps and tracking friction events over time. Additionally, some questions may fit with more than one way of measurement and take multiple metrics and properties to create a full picture.
Track KPIs with DXI tools
This is where a DXI tool comes into play. Established KPIs are implemented and tracked with a DXI tool, like FullStory for example, that allows you to track user engagement, pages, metrics, and funnels across your digital experience.
At this stage it is important to consider, “what are the proponents within a data source that would lead to solutions?” Some of the available measurement tools in FullStory include:
- Funnels – Funnels allow you to define key pages, clicks, and actions that are part of a defined user path and identify where users may be dropping off, thus giving insight into time to convert and overall conversion rate.
- Conversions – The Conversions feature provides a way to identify and address the most critical sources of friction that impact your customers’ experiences within key funnels. It also calculates the opportunity cost and projects the lost revenue resulting from unresolved issues.
- Journeys– Journeys offer a visual representation of how users navigate through your website, needing only a start- or endpoint to display the most common paths taken.
- Metrics – Metrics allow you to track a variety of KPIs such as identifying users experiencing a certain friction event, percentages of users visiting certain pages, top search term queries, and more.
Define all the funnels, pages, custom events, and trackable interactions that will help lead to a clearer view of user journeys and answer the questions you want to solve.
Evaluate the data to create a problem statement
It is important to define your research goals at the beginning so when you reach the point of analysis, you know what to look for. Here is an example of a question, KPI and DXI insight:
- Question: “What is preventing users from moving forward from our PDPs to our checkout funnel?”
- KPI: Funnel drop-offs between the product page (PDP) and checkout funnel.
- DXI Insight: Fullstory tells us that 30% of users are experiencing a friction event on the PDP page, specifically on the size selection.
Now that we have utilized FullStory to give us data that directly addresses our question, we can formulate a problem statement. Simplifying the data down to a single problem helps identify where to focus future research efforts and what insights are important.
- Problem Statement: Friction events, including errors and dead clicks, are preventing users from navigating from the product page to the checkout funnel.
Use a heuristic framework to identify opportunities and build a hypothesis
The next step in the process is to a build hypothesis about how to address the problem statement(s). Going into hypothesis creation with a good base of UX best practices and an established framework will lead to more guided exploration. A UX heuristic evaluation focuses on evaluating digital experiences based on UX best practices and guidelines. Using these heuristics as a point of reference to identify opportunities on your website can lead to hypothesis of possible UX solutions.
In practice, this looks like:
- Problem Statement: Friction events, including errors and dead clicks, are preventing users from navigating from the product page to the checkout funnel.
- Heuristic Evaluation shows: Element location limits visibility – The ‘Select a Size’ notification is too far below the fold.
- Therefore, the Hypothesis is: Users are not able to see the error message. They are not aware this is a required step before adding a product to the cart due to the location of the element and are abandoning the page when it is perceived the page is preventing them from moving forward.
Conduct usability testing to validate hypotheses and gather qualitative feedback
We know that DXI tools gather and present extreme amounts of data that allows us to see how users are engaging throughout the website. However, the main problem with DXI tools is that no matter how much you understand what users are doing on your site, it will never tell you why users are engaging this way. This is where integrating additional UX testing efforts to gather qualitative data becomes important to help you understand the motivations behind user behavior. Although we have been able to form hypotheses on data about what we think is happening, we have the opportunity to validate this through user testing thus gathering unbiased user feedback.
When validating (or disproving) hypotheses with user feedback there are a few best practices to follow:
- Ensure your user testing audience matches your target demographic. Gathering feedback from panelists is only helpful if they align with your actual users.
- Simulate the user journey. Although you have data that points to the friction points, it is important to mimic the most authentic user experience during usability testing, so the user is not swayed in any way. Have the user conduct the normal steps they would go through when visiting the site so that friction points or usability issues can arise organically.
- Ask follow-up questions. Once user testing panelists encounter issues, dig further to understand their emotions during the occurrence and watch what action they take to resolve the issue. This insight will be incredibly valuable to know if your hypothetical solutions are on the right track.
Wireframe solutions to friction points to improve the user experience
Now that we understand both what users are experiencing and the behavioral influences that lead to those experiences, we can formulate UX innovations and solutions that streamline and strengthen the user experience. Wireframing solutions to friction points in the user experience can help visualize proposed outcomes in a low-fidelity manner.
Create a feedback loop to continually improve your digital experience
As with any proposed change to digital experience, testing is of the utmost importance. Utilizing A/B testing to evaluate a proposed change against the original user interface can reveal how innovations are adopted and influence the overall user journey. DXI tools allow you to compare A/B test performance within the platform itself. As A/B tests are deployed, continue to measure the experience on the same scale to accurately benchmark success. The original KPIs established will indicate if your hypotheses are proven or disproven. If one test is performing better than the other, you can begin the cycle again to ascertain why and dive deeper into the mind of the user. This iterative feedback loop will enable us to analyze DXI data and UX testing outcomes in relation to each other through an expert lens, fostering greater innovation as a result.